 20
20peptides
spectra
0.000 | 0.000
0.000 | 0.000
0.000 | 0.000
0.623 | 0.636
0.306 | 0.321
0.000 | 0.000
0.000 | 0.000
0.054 | 0.058
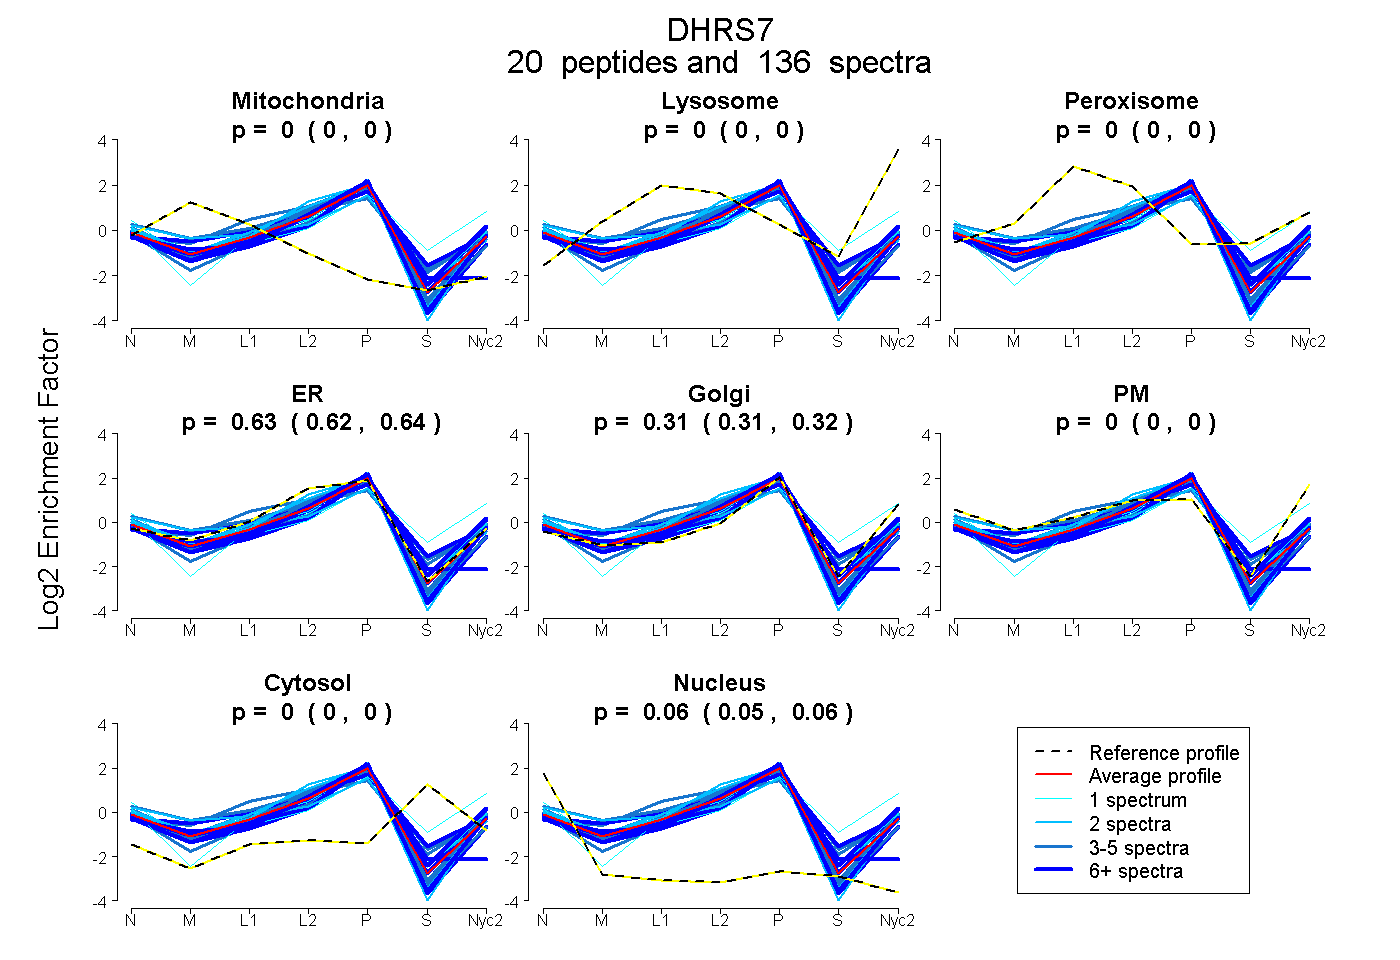
| Plot | Mito | Lyso | Perox | ER | Golgi | PM | Cytosol | Nucleus | |||||
| Expt A |
20 peptides |
136 spectra |
|
0.000 0.000 | 0.000 |
0.000 0.000 | 0.000 |
0.000 0.000 | 0.000 |
0.630 0.623 | 0.636 |
0.314 0.306 | 0.321 |
0.000 0.000 | 0.000 |
0.000 0.000 | 0.000 |
0.056 0.054 | 0.058 |
| 1 spectrum, ADADLTLLWAEWQGR | 0.000 | 0.000 | 0.000 | 0.511 | 0.321 | 0.085 | 0.000 | 0.082 | ||
| 2 spectra, IDILVNNGGR | 0.000 | 0.000 | 0.000 | 0.852 | 0.095 | 0.030 | 0.000 | 0.023 | ||
| 2 spectra, ENIDQSYK | 0.151 | 0.000 | 0.000 | 0.468 | 0.333 | 0.021 | 0.000 | 0.028 | ||
| 7 spectra, LGVCLVLSAR | 0.000 | 0.000 | 0.000 | 0.806 | 0.000 | 0.000 | 0.036 | 0.158 | ||
| 3 spectra, AVLQEFGK | 0.000 | 0.000 | 0.000 | 0.618 | 0.207 | 0.146 | 0.003 | 0.027 | ||
| 1 spectrum, LMLISMANDLK | 0.000 | 0.000 | 0.000 | 0.472 | 0.450 | 0.000 | 0.002 | 0.076 | ||
| 17 spectra, AYVWQYVPFR | 0.000 | 0.000 | 0.000 | 0.558 | 0.338 | 0.000 | 0.000 | 0.104 | ||
| 5 spectra, GQELER | 0.000 | 0.000 | 0.000 | 0.629 | 0.349 | 0.000 | 0.000 | 0.022 | ||
| 9 spectra, CVLPHMMER | 0.014 | 0.000 | 0.093 | 0.536 | 0.251 | 0.000 | 0.106 | 0.000 | ||
| 27 spectra, TVLQEFGR | 0.000 | 0.000 | 0.000 | 0.472 | 0.507 | 0.000 | 0.013 | 0.008 | ||
| 2 spectra, NALTEELTKPMR | 0.000 | 0.000 | 0.000 | 0.810 | 0.165 | 0.000 | 0.000 | 0.025 | ||
| 5 spectra, CLENGNLK | 0.067 | 0.000 | 0.000 | 0.933 | 0.000 | 0.000 | 0.000 | 0.000 | ||
| 12 spectra, VLGITWYR | 0.000 | 0.000 | 0.000 | 0.611 | 0.346 | 0.000 | 0.000 | 0.043 | ||
| 23 spectra, GFFDVLR | 0.000 | 0.000 | 0.000 | 0.537 | 0.422 | 0.000 | 0.000 | 0.041 | ||
| 3 spectra, AAWMGQCPEQALADK | 0.000 | 0.000 | 0.000 | 0.478 | 0.328 | 0.000 | 0.160 | 0.034 | ||
| 8 spectra, DWILQGR | 0.000 | 0.000 | 0.000 | 0.283 | 0.669 | 0.000 | 0.000 | 0.048 | ||
| 1 spectrum, ELMNLNYLGTVSLTK | 0.000 | 0.006 | 0.044 | 0.000 | 0.520 | 0.246 | 0.184 | 0.000 | ||
| 1 spectrum, DILVLPLDLADTSSHDIATK | 0.000 | 0.000 | 0.000 | 0.619 | 0.341 | 0.000 | 0.000 | 0.040 | ||
| 4 spectra, CVLPHMVER | 0.072 | 0.000 | 0.055 | 0.568 | 0.065 | 0.176 | 0.051 | 0.012 | ||
| 3 spectra, GFFNALHSELGK | 0.000 | 0.000 | 0.000 | 0.662 | 0.303 | 0.000 | 0.000 | 0.035 |
| Plot | Mito | Lyso or Perox | ER | Golgi | PM | Cytosol | Nucleus | ||||||
| Expt B |
13 peptides |
86 spectra |
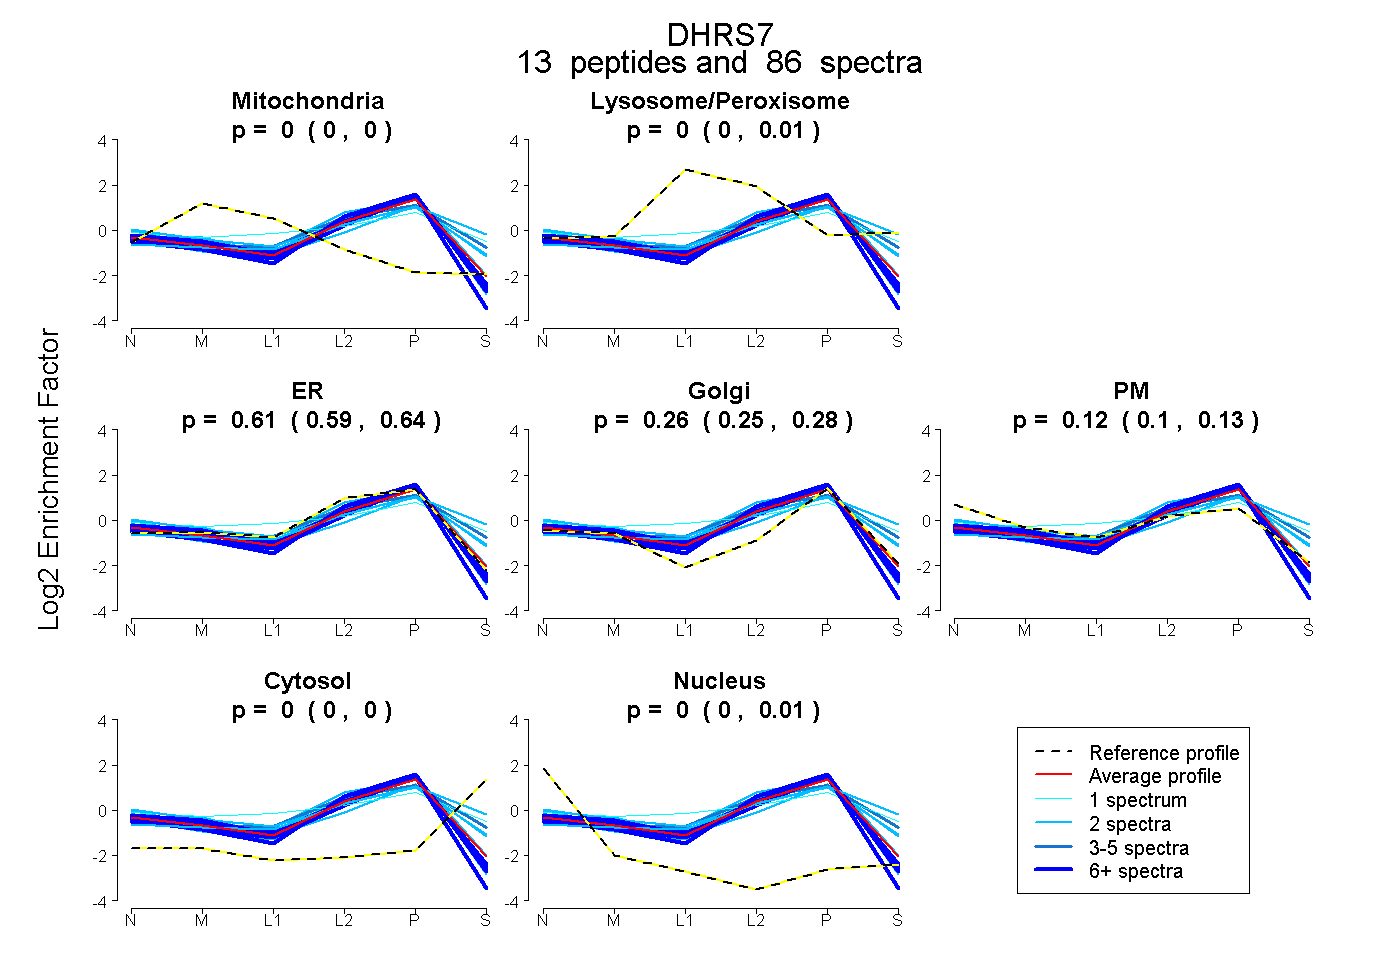 |
0.000 0.000 | 0.000 |
0.002 0.000 | 0.012 |
0.610 0.590 | 0.637 |
0.264 0.247 | 0.279 |
0.124 0.102 | 0.128 |
0.000 0.000 | 0.003 |
0.000 0.000 | 0.007 |
|||
| Plot | Lyso | Other | |||||||||||
| Expt C |
15 peptides |
136 spectra |
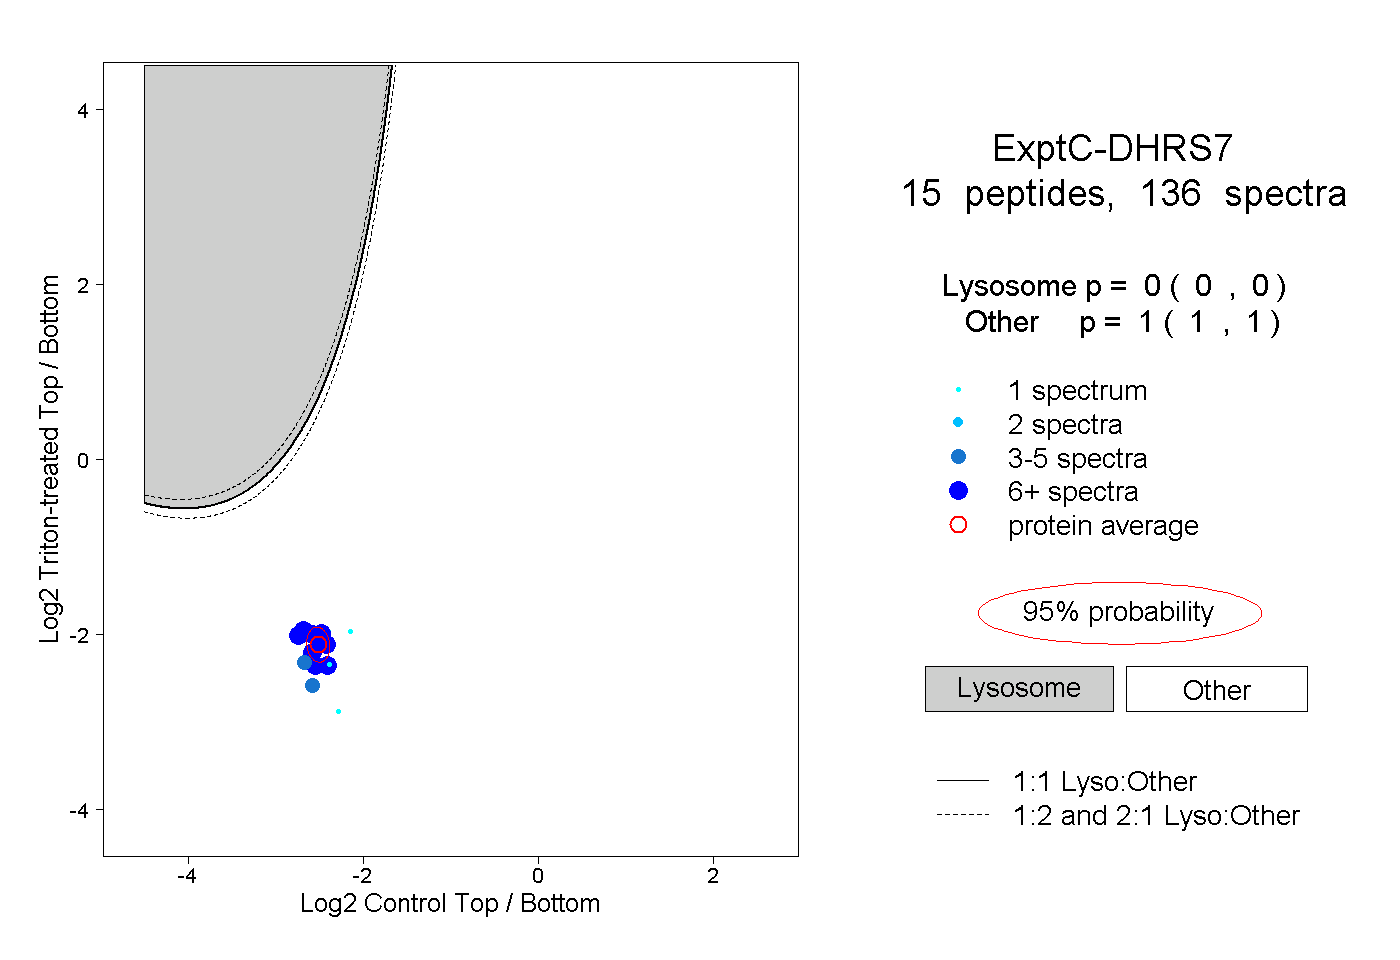 |
0.000 0.000 | 0.000 |
1.000 1.000 | 1.000 |
||||||||
| Plot | Lyso | Other | |||||||||||
| Expt D |
4 peptides |
16 spectra |
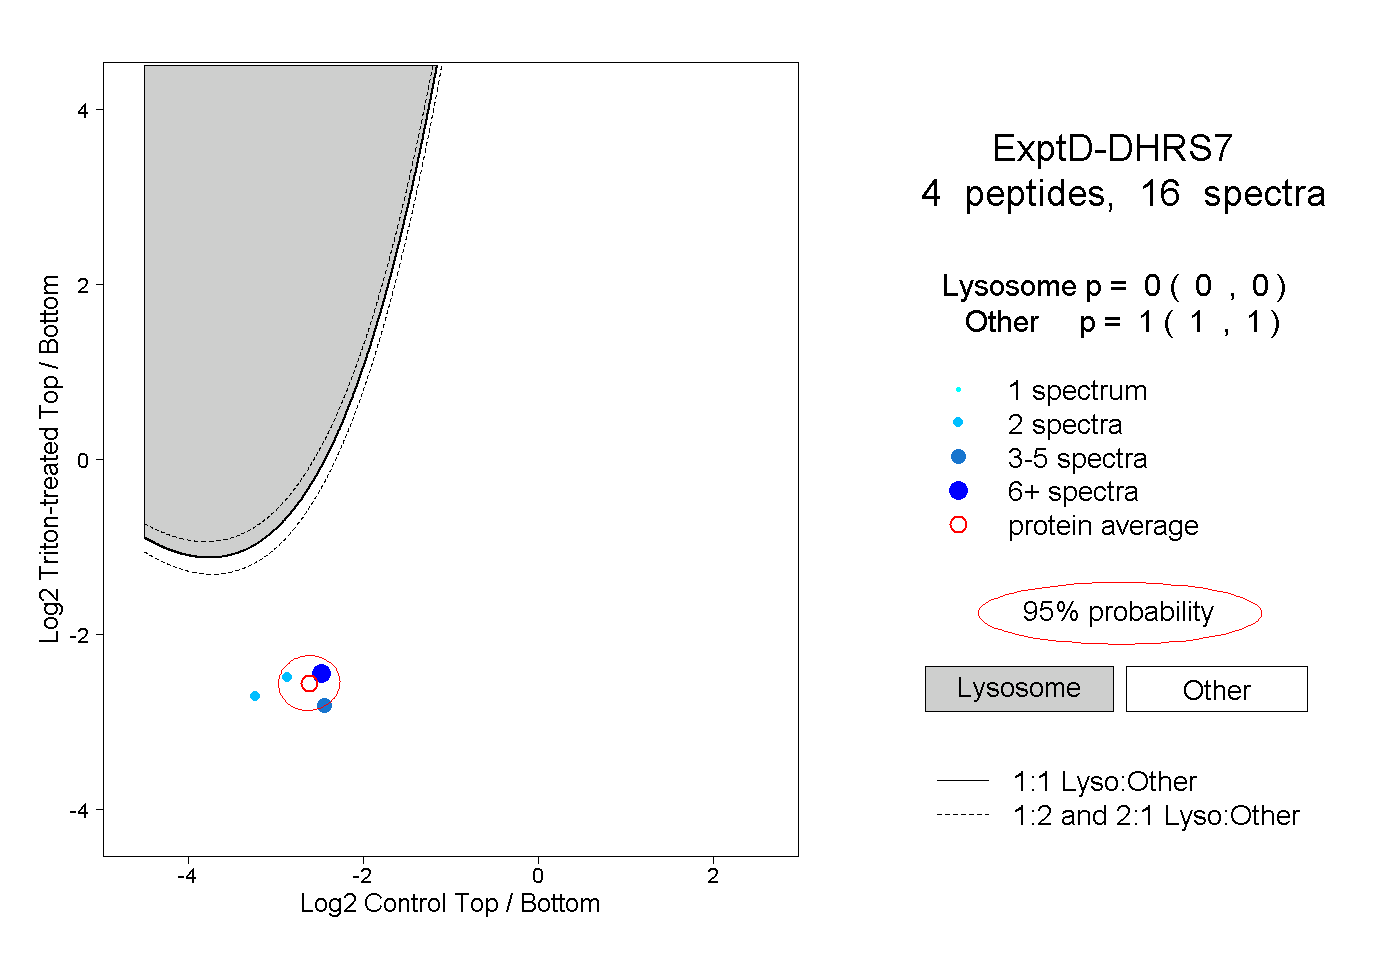 |
0.000 0.000 | 0.000 |
1.000 1.000 | 1.000 |