36
36peptides
spectra
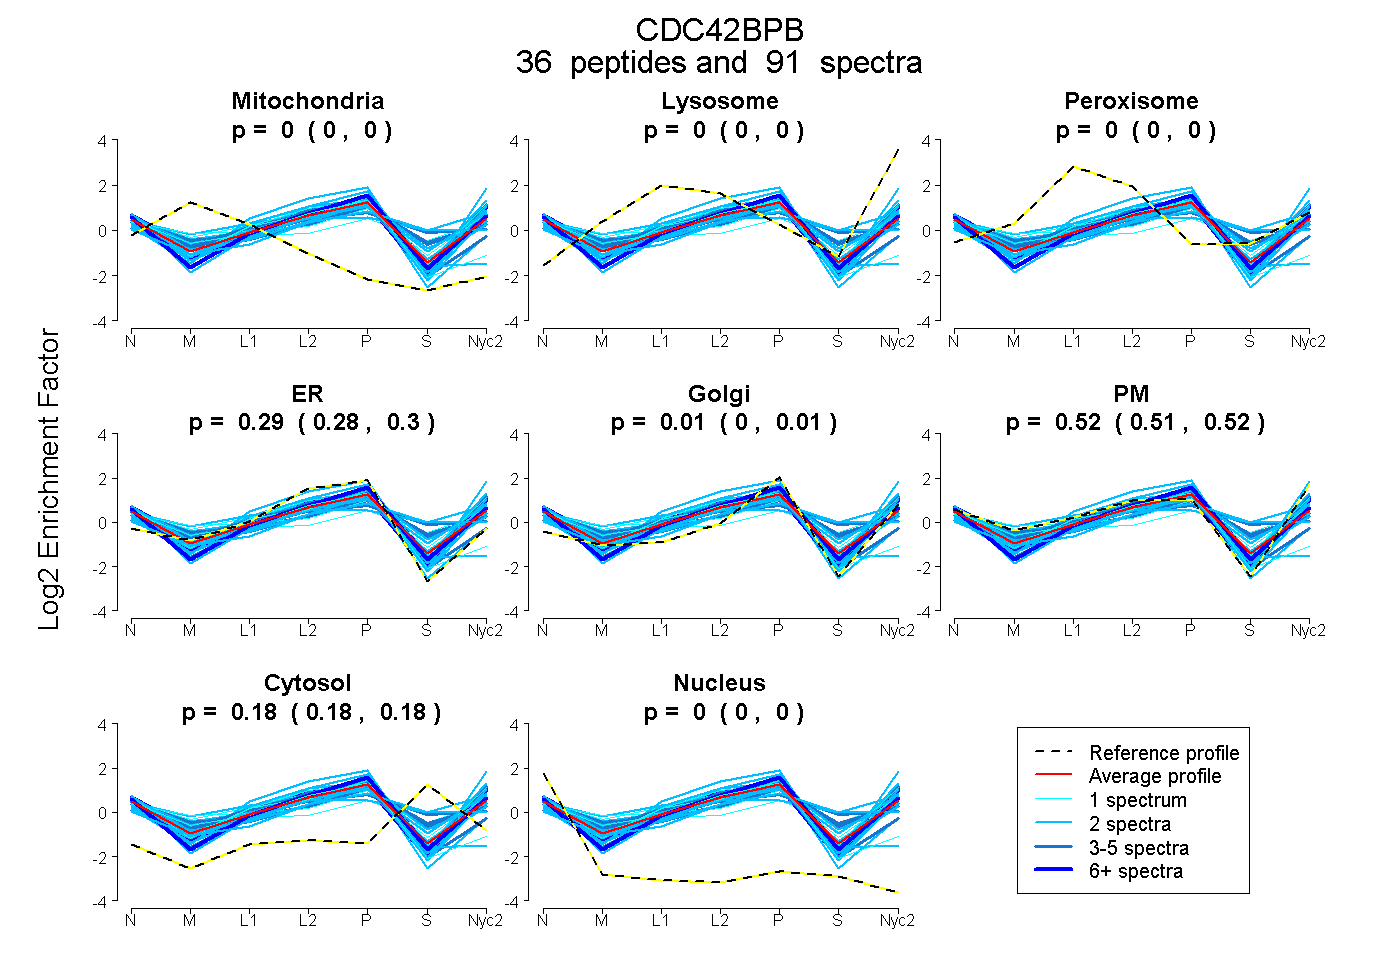
0.000 | 0.000
0.000 | 0.000
0.000 | 0.000
0.285 | 0.300
0.000 | 0.011
0.512 | 0.525
0.179 | 0.185
0.000 | 0.000
11peptides
spectra
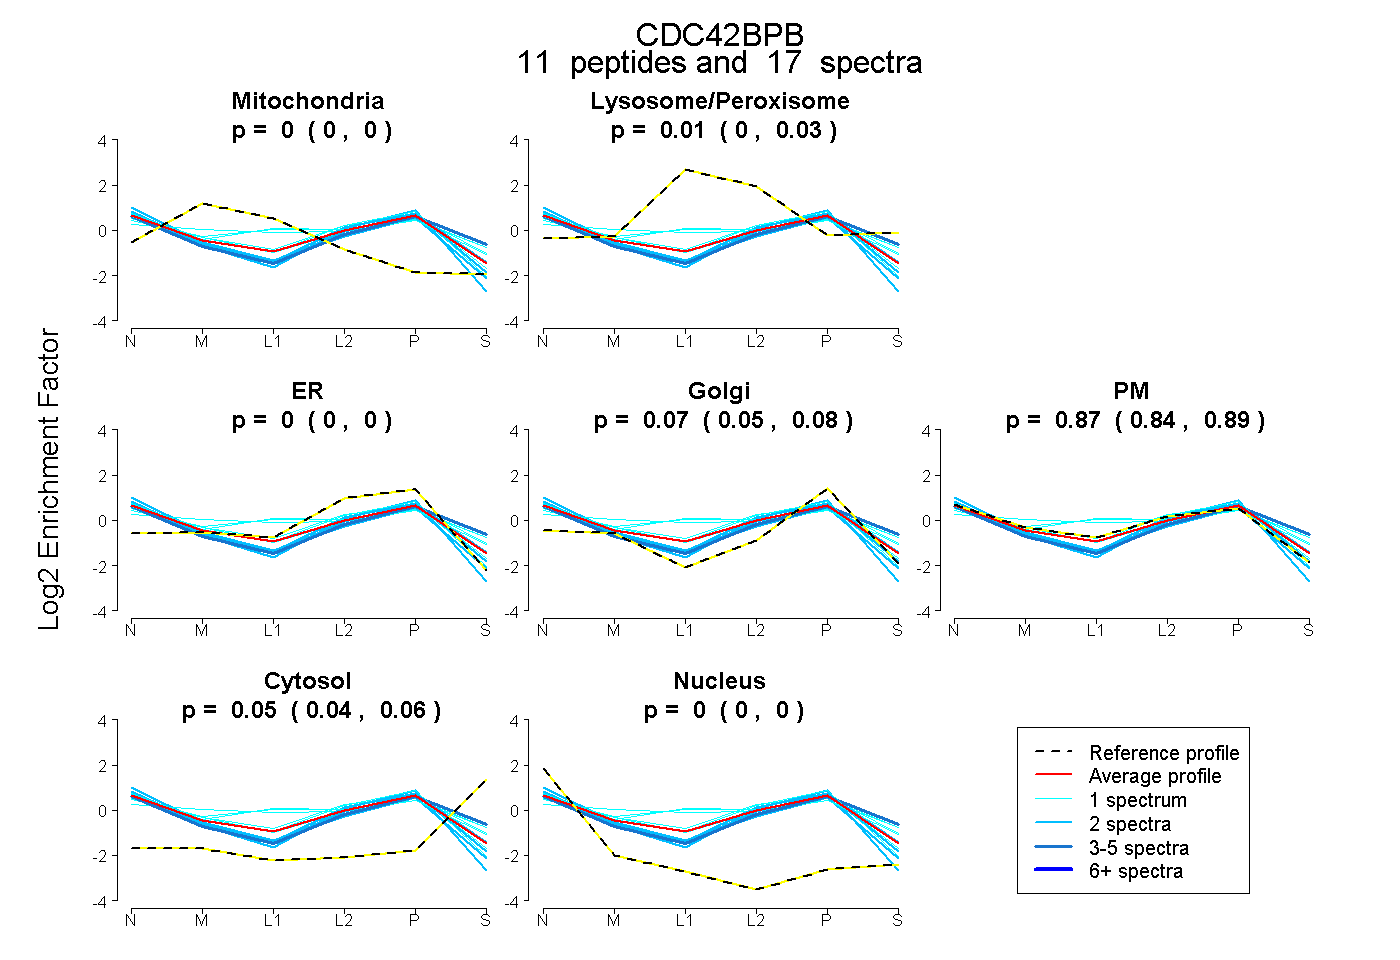
0.000 | 0.000
0.000 | 0.028
0.000 | 0.000
0.050 | 0.083
0.843 | 0.890
0.038 | 0.060
0.000 | 0.000