 36
36peptides
spectra
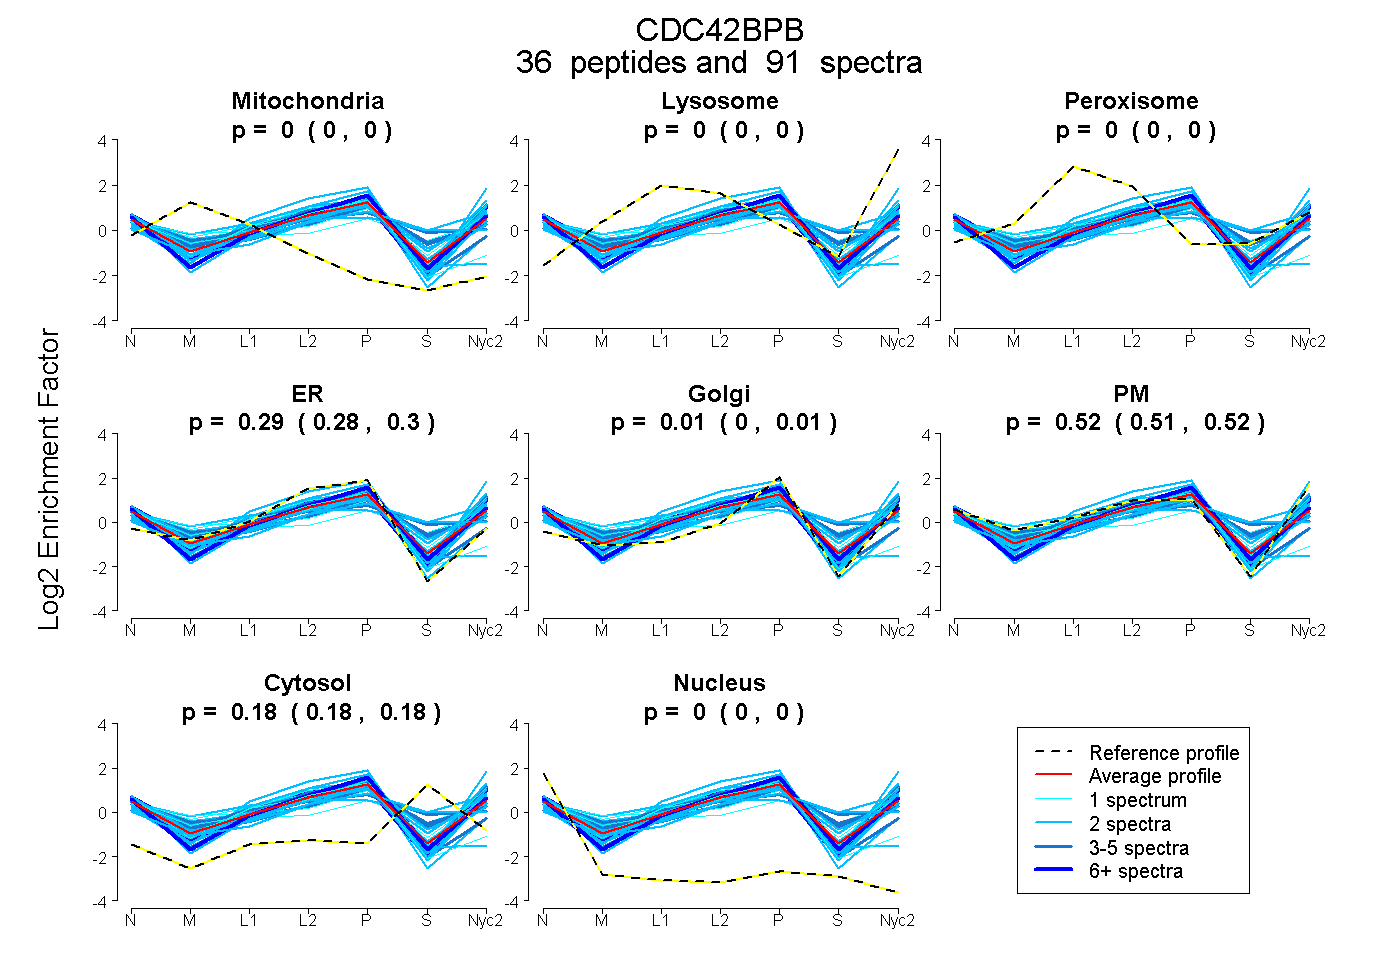
0.000 | 0.000
0.000 | 0.000
0.000 | 0.000
0.285 | 0.300
0.000 | 0.011
0.512 | 0.525
0.179 | 0.185
0.000 | 0.000
| Plot | Mito | Lyso | Perox | ER | Golgi | PM | Cytosol | Nucleus | |||||
| Expt A |
36 peptides |
91 spectra |
|
0.000 0.000 | 0.000 |
0.000 0.000 | 0.000 |
0.000 0.000 | 0.000 |
0.294 0.285 | 0.300 |
0.005 0.000 | 0.011 |
0.519 0.512 | 0.525 |
0.182 0.179 | 0.185 |
0.000 0.000 | 0.000 |
| 1 spectrum, DTSLAFESK | 0.040 | 0.000 | 0.038 | 0.000 | 0.000 | 0.582 | 0.340 | 0.000 | ||
| 3 spectra, GYLQALASK | 0.037 | 0.000 | 0.000 | 0.257 | 0.077 | 0.485 | 0.137 | 0.007 | ||
| 2 spectra, TLDPLWK | 0.000 | 0.000 | 0.004 | 0.196 | 0.105 | 0.425 | 0.269 | 0.000 | ||
| 2 spectra, QLVEASER | 0.000 | 0.000 | 0.000 | 0.214 | 0.166 | 0.545 | 0.042 | 0.033 | ||
| 2 spectra, DIPCIFR | 0.000 | 0.000 | 0.000 | 0.649 | 0.000 | 0.256 | 0.000 | 0.095 | ||
| 1 spectrum, FQFPSHVTDVSEEAK | 0.000 | 0.000 | 0.123 | 0.168 | 0.000 | 0.583 | 0.126 | 0.000 | ||
| 5 spectra, LEDAVAEASK | 0.000 | 0.000 | 0.000 | 0.094 | 0.000 | 0.771 | 0.135 | 0.000 | ||
| 2 spectra, VLFYEEELVR | 0.000 | 0.000 | 0.000 | 0.242 | 0.155 | 0.508 | 0.086 | 0.010 | ||
| 2 spectra, HSEMEEAIGAMK | 0.000 | 0.000 | 0.187 | 0.000 | 0.000 | 0.486 | 0.327 | 0.000 | ||
| 1 spectrum, DIKPDNVLLDVNGHIR | 0.000 | 0.000 | 0.147 | 0.269 | 0.089 | 0.344 | 0.151 | 0.000 | ||
| 2 spectra, MTEELETLR | 0.000 | 0.000 | 0.000 | 0.128 | 0.057 | 0.546 | 0.268 | 0.000 | ||
| 2 spectra, QGPAPTGLPR | 0.000 | 0.098 | 0.000 | 0.237 | 0.144 | 0.454 | 0.067 | 0.000 | ||
| 4 spectra, IMNHEER | 0.000 | 0.000 | 0.003 | 0.213 | 0.007 | 0.448 | 0.330 | 0.000 | ||
| 1 spectrum, SSSLGSR | 0.000 | 0.000 | 0.000 | 0.101 | 0.022 | 0.730 | 0.146 | 0.000 | ||
| 2 spectra, VTASLLGSPSK | 0.000 | 0.000 | 0.024 | 0.251 | 0.000 | 0.303 | 0.422 | 0.000 | ||
| 9 spectra, EDFEILK | 0.000 | 0.000 | 0.000 | 0.175 | 0.000 | 0.744 | 0.063 | 0.019 | ||
| 1 spectrum, TKPFHR | 0.000 | 0.000 | 0.015 | 0.317 | 0.000 | 0.536 | 0.133 | 0.000 | ||
| 6 spectra, ALQEFSELNER | 0.000 | 0.000 | 0.000 | 0.228 | 0.169 | 0.447 | 0.156 | 0.000 | ||
| 1 spectrum, LPEDMAR | 0.049 | 0.000 | 0.117 | 0.000 | 0.238 | 0.452 | 0.144 | 0.000 | ||
| 7 spectra, VPEEER | 0.000 | 0.000 | 0.000 | 0.310 | 0.161 | 0.391 | 0.135 | 0.003 | ||
| 2 spectra, NKPYVSWPSSGGSEPGVPVPLR | 0.000 | 0.146 | 0.000 | 0.217 | 0.147 | 0.490 | 0.000 | 0.000 | ||
| 2 spectra, TVLAAAIVDGDR | 0.000 | 0.000 | 0.000 | 0.233 | 0.000 | 0.556 | 0.186 | 0.025 | ||
| 3 spectra, RPLGVDVQR | 0.000 | 0.000 | 0.013 | 0.267 | 0.000 | 0.591 | 0.129 | 0.000 | ||
| 2 spectra, LELQSALEAEIR | 0.000 | 0.000 | 0.000 | 0.189 | 0.171 | 0.472 | 0.153 | 0.014 | ||
| 2 spectra, LVLCYEIQR | 0.000 | 0.000 | 0.019 | 0.738 | 0.000 | 0.000 | 0.090 | 0.153 | ||
| 1 spectrum, DLENSLQIEAYER | 0.000 | 0.000 | 0.000 | 0.209 | 0.081 | 0.545 | 0.154 | 0.010 | ||
| 4 spectra, ELLEEMQSLK | 0.000 | 0.000 | 0.000 | 0.233 | 0.029 | 0.405 | 0.333 | 0.000 | ||
| 3 spectra, HAFFEGLNWENIR | 0.000 | 0.000 | 0.221 | 0.209 | 0.067 | 0.183 | 0.321 | 0.000 | ||
| 4 spectra, GCQLIATGTLR | 0.000 | 0.000 | 0.054 | 0.563 | 0.000 | 0.259 | 0.011 | 0.113 | ||
| 1 spectrum, VPKPTGVK | 0.000 | 0.000 | 0.000 | 0.315 | 0.000 | 0.528 | 0.157 | 0.000 | ||
| 2 spectra, GIGTAYK | 0.028 | 0.000 | 0.027 | 0.221 | 0.174 | 0.509 | 0.000 | 0.040 | ||
| 2 spectra, LEQLLLDGPWR | 0.000 | 0.000 | 0.000 | 0.237 | 0.027 | 0.691 | 0.041 | 0.004 | ||
| 1 spectrum, SSSTCLFVAVK | 0.000 | 0.000 | 0.063 | 0.771 | 0.000 | 0.000 | 0.000 | 0.166 | ||
| 2 spectra, QLEDTVTLR | 0.000 | 0.000 | 0.000 | 0.306 | 0.028 | 0.525 | 0.142 | 0.000 | ||
| 2 spectra, LFLYDLPEGK | 0.000 | 0.000 | 0.000 | 0.344 | 0.074 | 0.394 | 0.164 | 0.025 | ||
| 2 spectra, LADFGSCLK | 0.047 | 0.000 | 0.133 | 0.071 | 0.165 | 0.544 | 0.039 | 0.000 |
| Plot | Mito | Lyso or Perox | ER | Golgi | PM | Cytosol | Nucleus | ||||||
| Expt B |
11 peptides |
17 spectra |
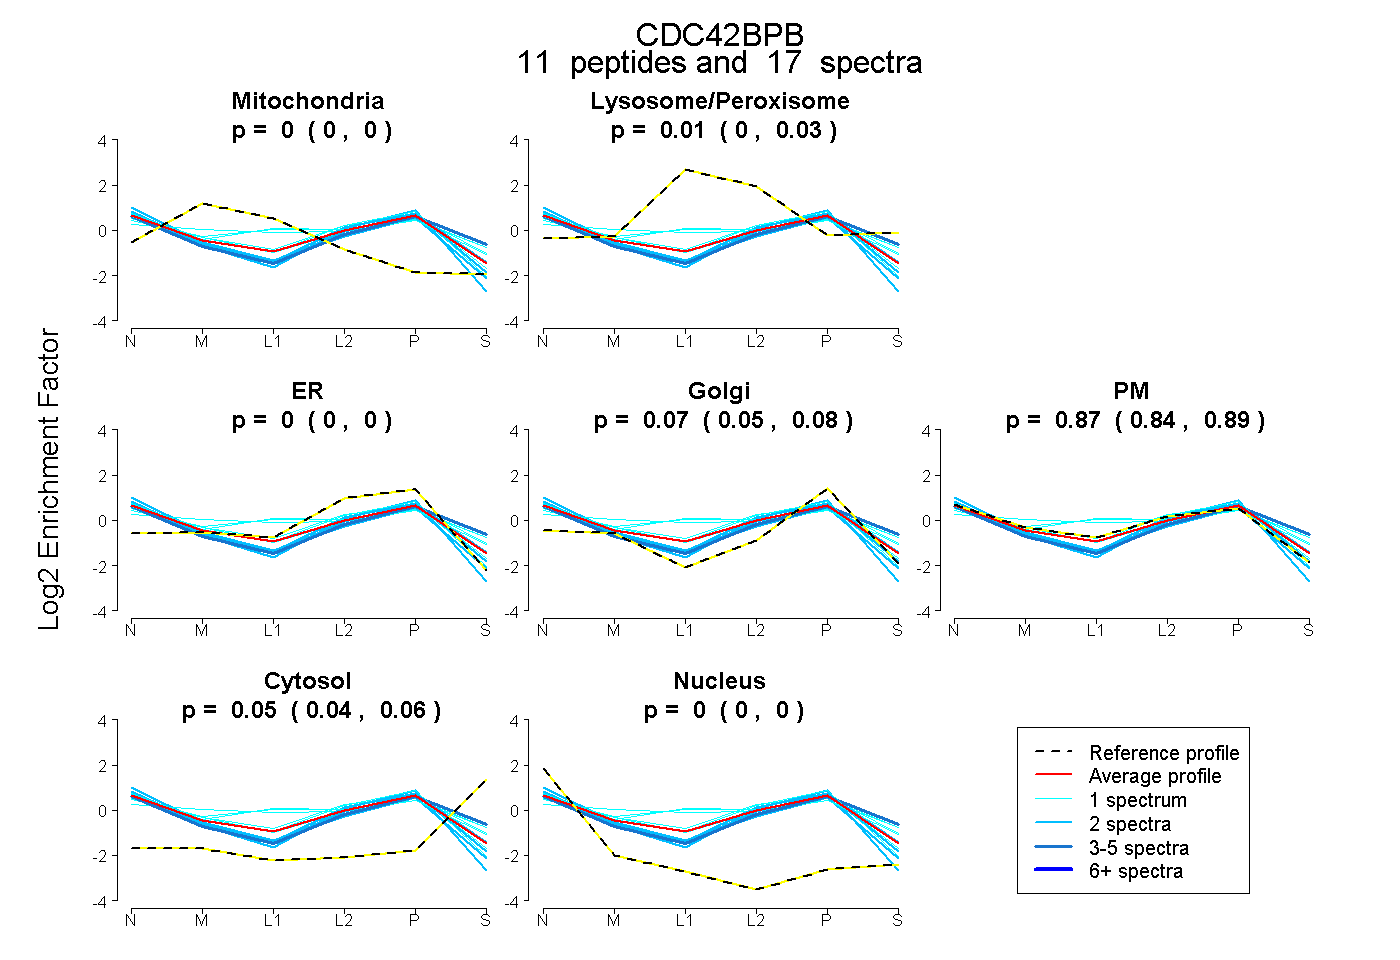 |
0.000 0.000 | 0.000 |
0.013 0.000 | 0.028 |
0.000 0.000 | 0.000 |
0.068 0.050 | 0.083 |
0.869 0.843 | 0.890 |
0.050 0.038 | 0.060 |
0.000 0.000 | 0.000 |
|||
| Plot | Lyso | Other | |||||||||||
| Expt C |
38 peptides |
124 spectra |
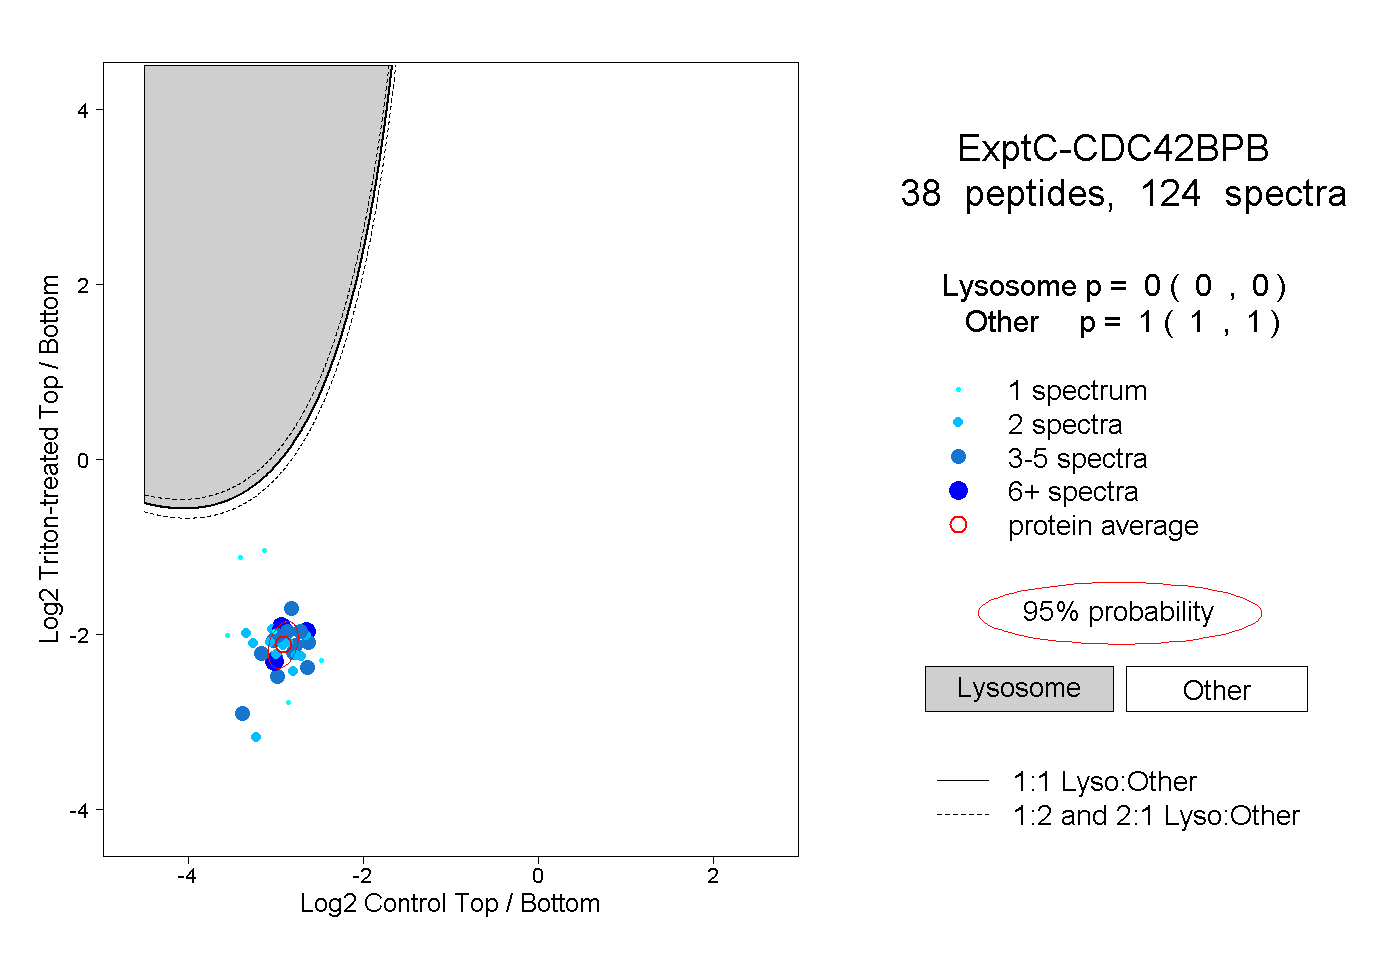 |
0.000 0.000 | 0.000 |
1.000 1.000 | 1.000 |
||||||||
| Plot | Lyso | Other | |||||||||||
| Expt D |
10 peptides |
16 spectra |
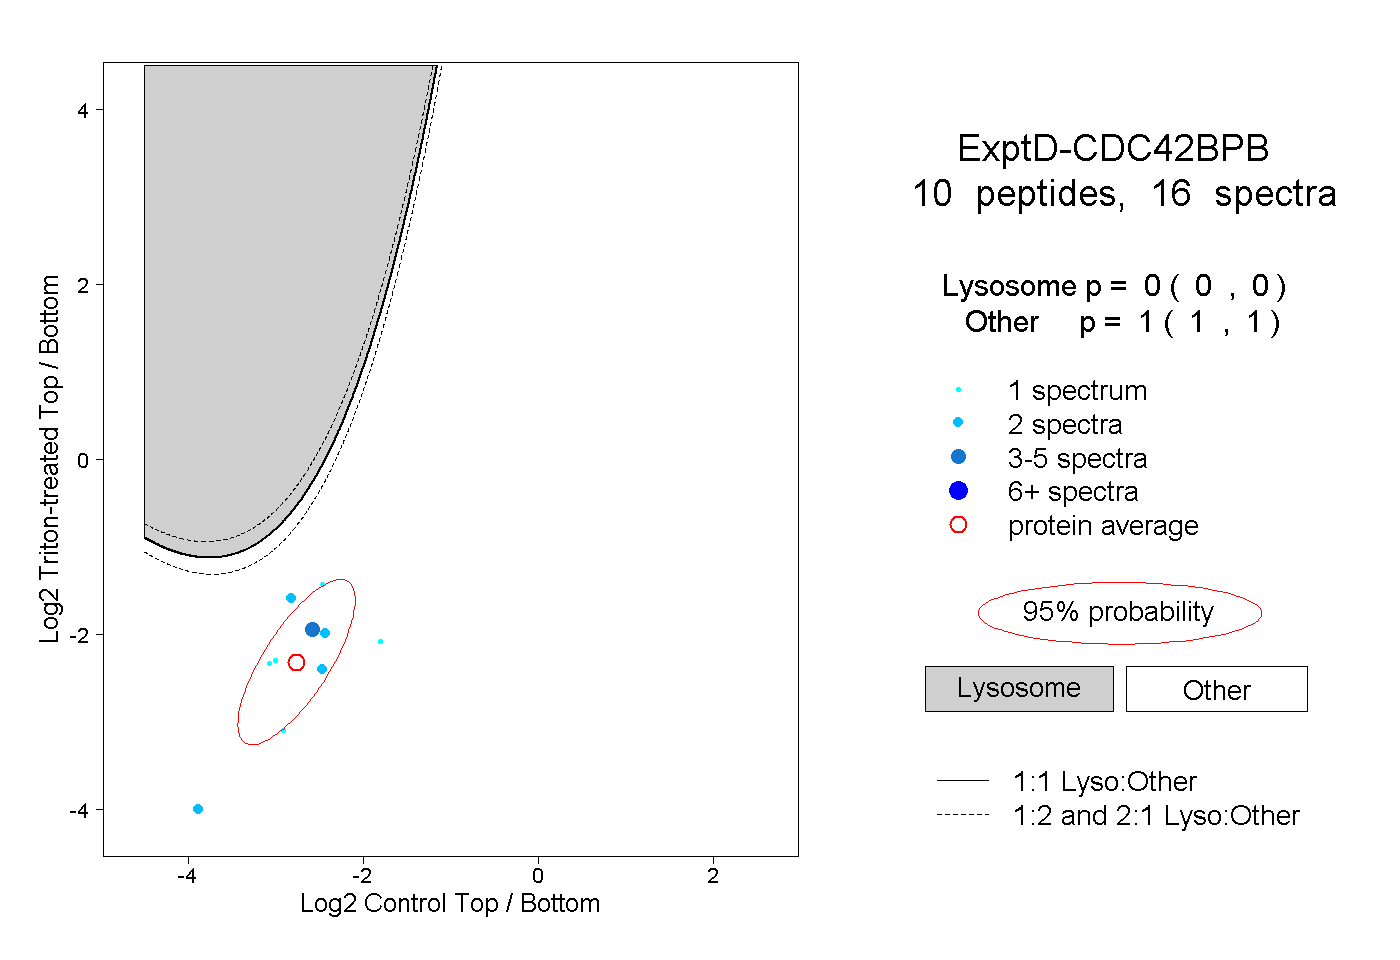 |
0.000 0.000 | 0.000 |
1.000 1.000 | 1.000 |