 4
4peptides
spectra
0.000 | 0.000
0.000 | 0.000
0.015 | 0.084
0.000 | 0.056
0.048 | 0.168
0.038 | 0.158
0.686 | 0.734
0.000 | 0.000
5peptides
spectra
0.000 | 0.000
1.000 | 1.000
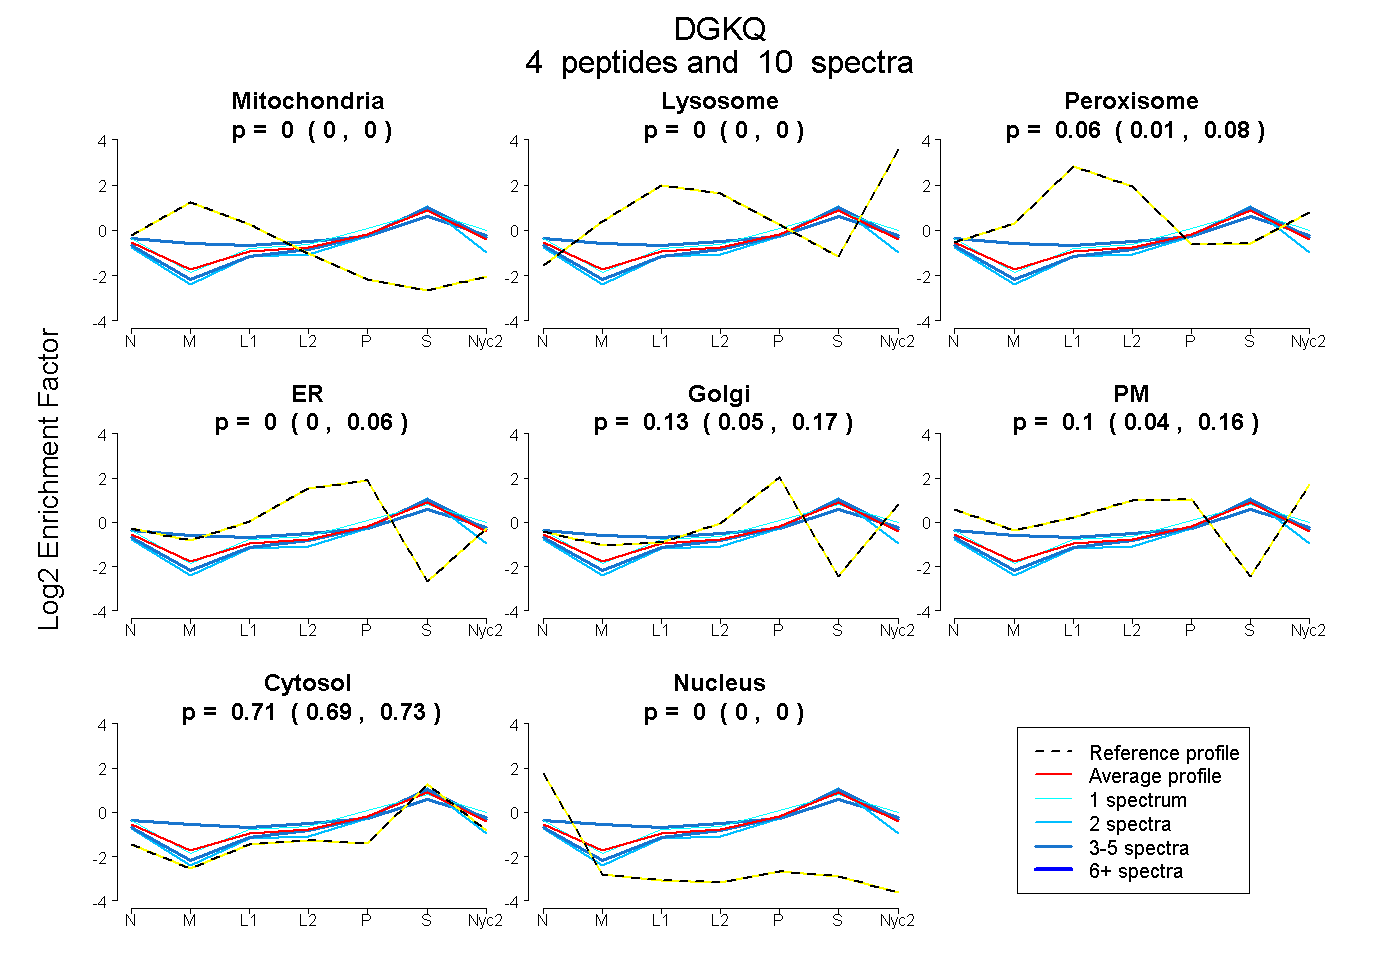
| Plot | Mito | Lyso | Perox | ER | Golgi | PM | Cytosol | Nucleus | |||||
| Expt A |
4 peptides |
10 spectra |
|
0.000 0.000 | 0.000 |
0.000 0.000 | 0.000 |
0.059 0.015 | 0.084 |
0.000 0.000 | 0.056 |
0.134 0.048 | 0.168 |
0.098 0.038 | 0.158 |
0.709 0.686 | 0.734 |
0.000 0.000 | 0.000 |
||
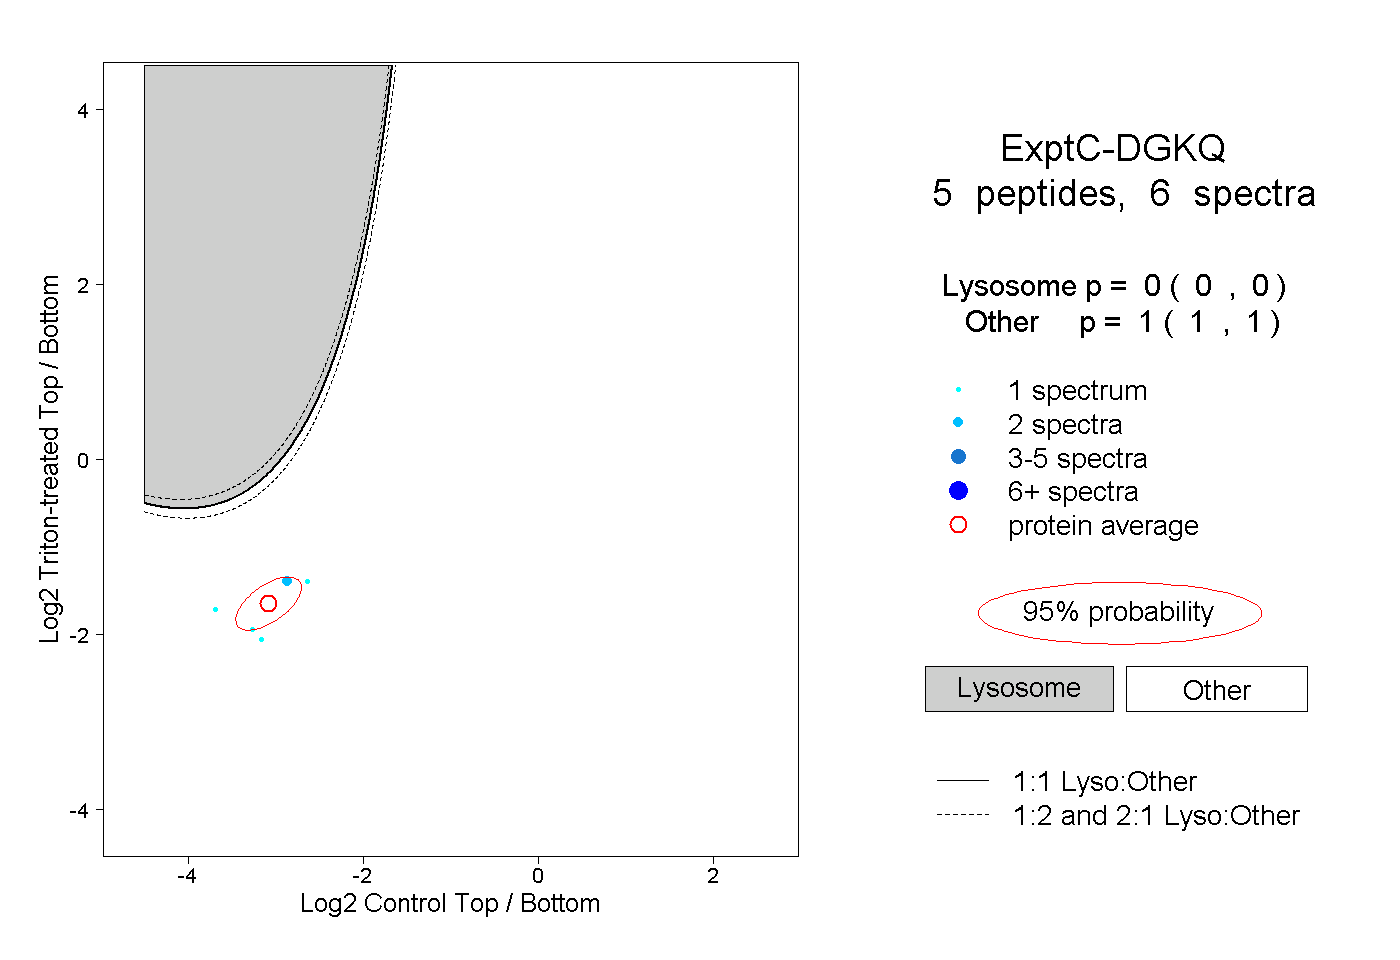
| Plot | Lyso | Other | |||||||||||
| Expt C |
5 peptides |
6 spectra |
|
0.000 0.000 | 0.000 |
1.000 1.000 | 1.000 |