 2
2peptides
spectra
NA | NA
NA | NA
NA | NA
NA | NA
NA | NA
NA | NA
NA | NA
NA | NA
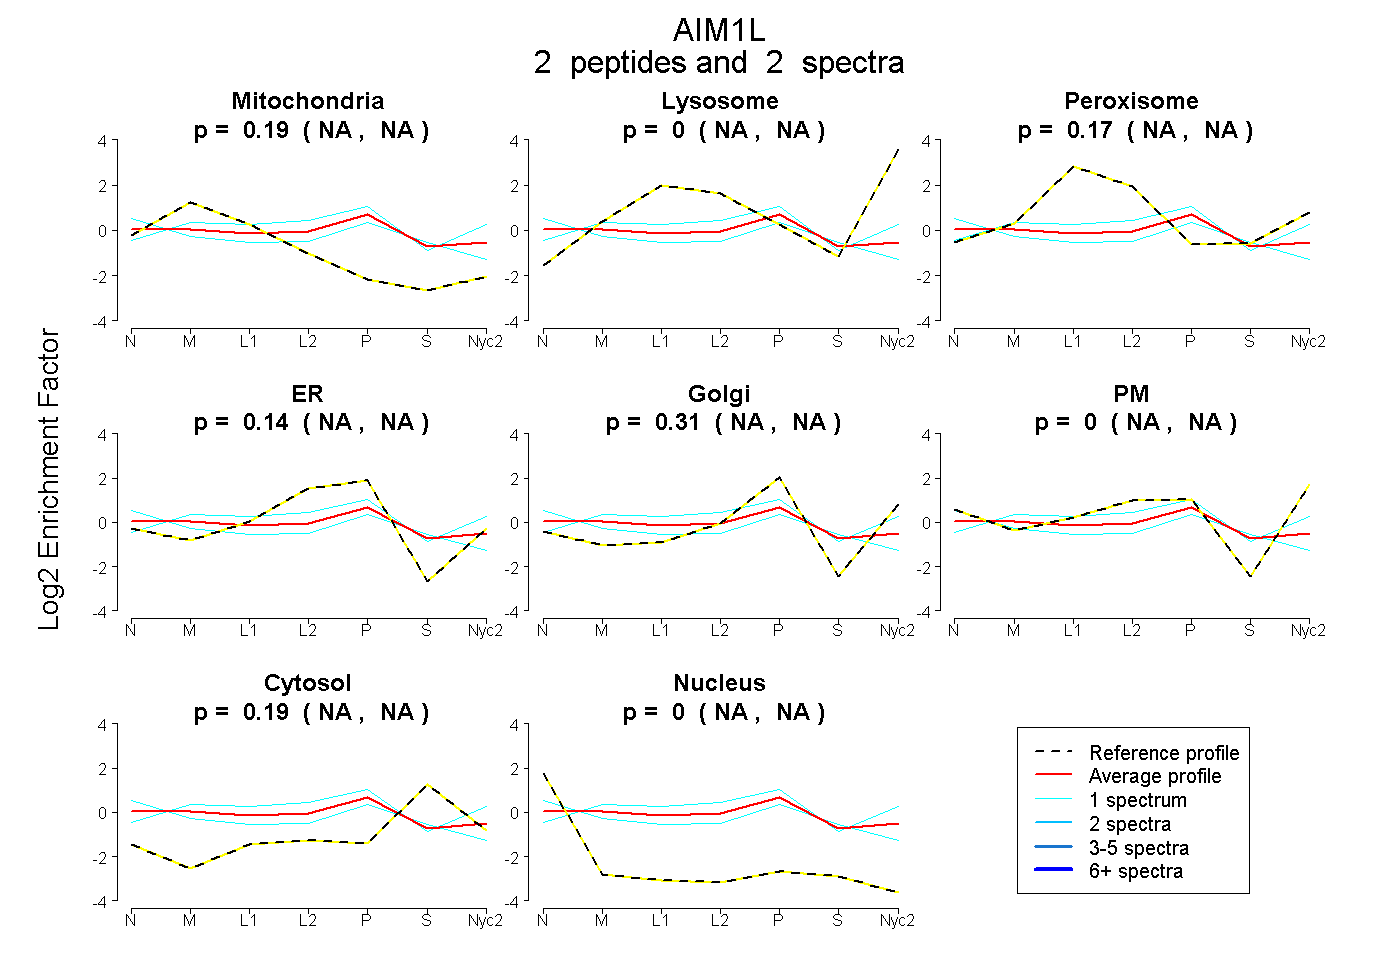
| Plot | Mito | Lyso | Perox | ER | Golgi | PM | Cytosol | Nucleus | |||||
| Expt A |
2 peptides |
2 spectra |
|
0.185 NA | NA |
0.000 NA | NA |
0.171 NA | NA |
0.142 NA | NA |
0.308 NA | NA |
0.000 NA | NA |
0.193 NA | NA |
0.000 NA | NA |
| 1 spectrum, TEAPQEDVFEHSFR | 0.224 | 0.000 | 0.009 | 0.301 | 0.023 | 0.081 | 0.301 | 0.062 | ||
| 1 spectrum, AVVVSPR | 0.080 | 0.000 | 0.358 | 0.000 | 0.497 | 0.000 | 0.065 | 0.000 |