 3
3peptides
spectra
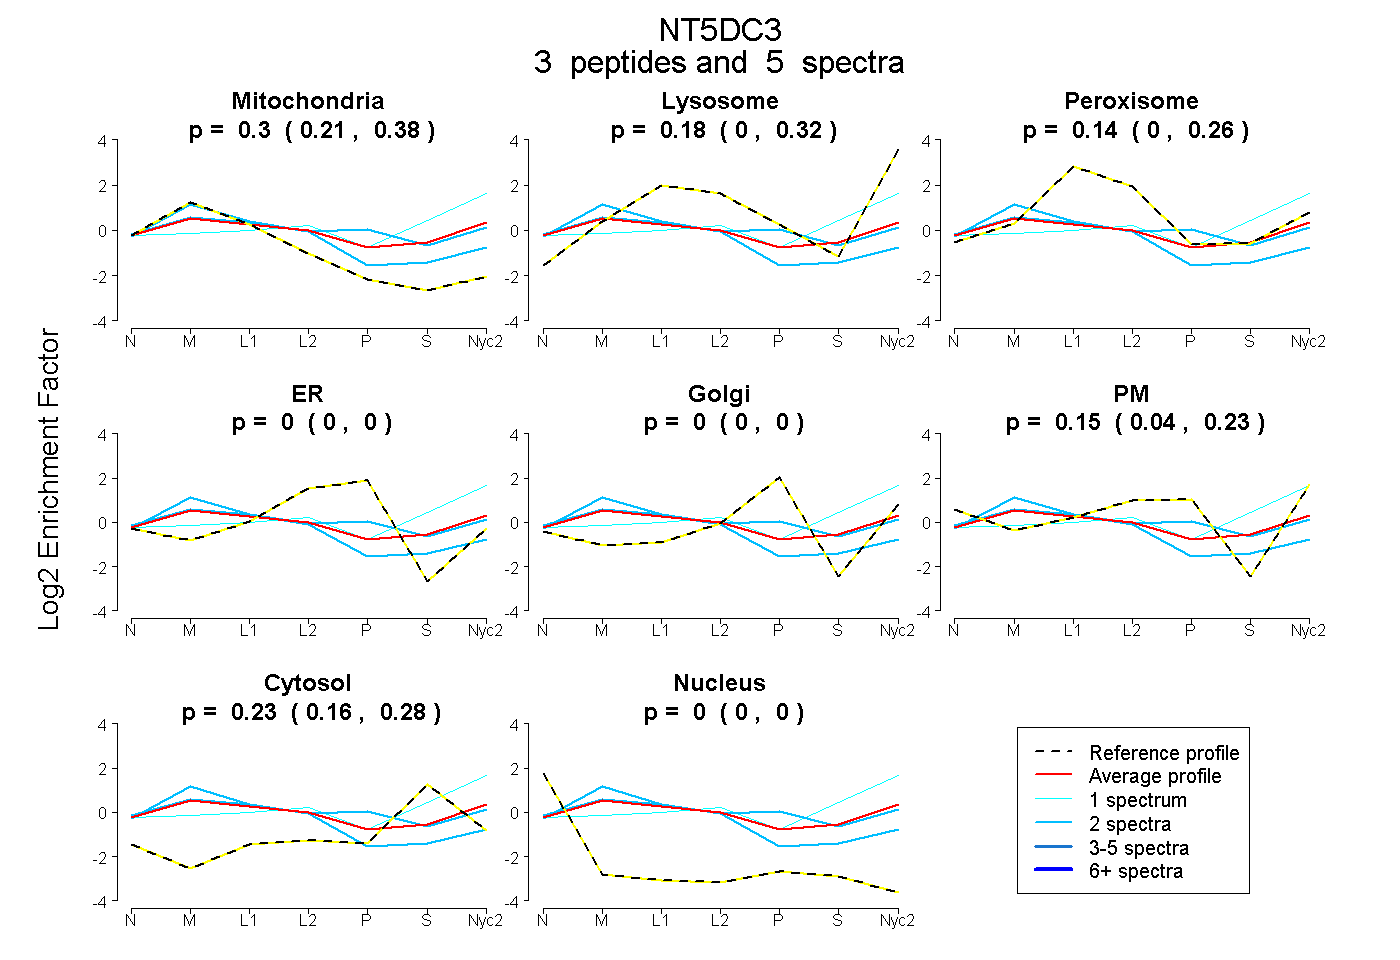
0.213 | 0.375
0.000 | 0.321
0.000 | 0.262
0.000 | 0.000
0.000 | 0.000
0.040 | 0.226
0.164 | 0.283
0.000 | 0.000
2peptides
spectra
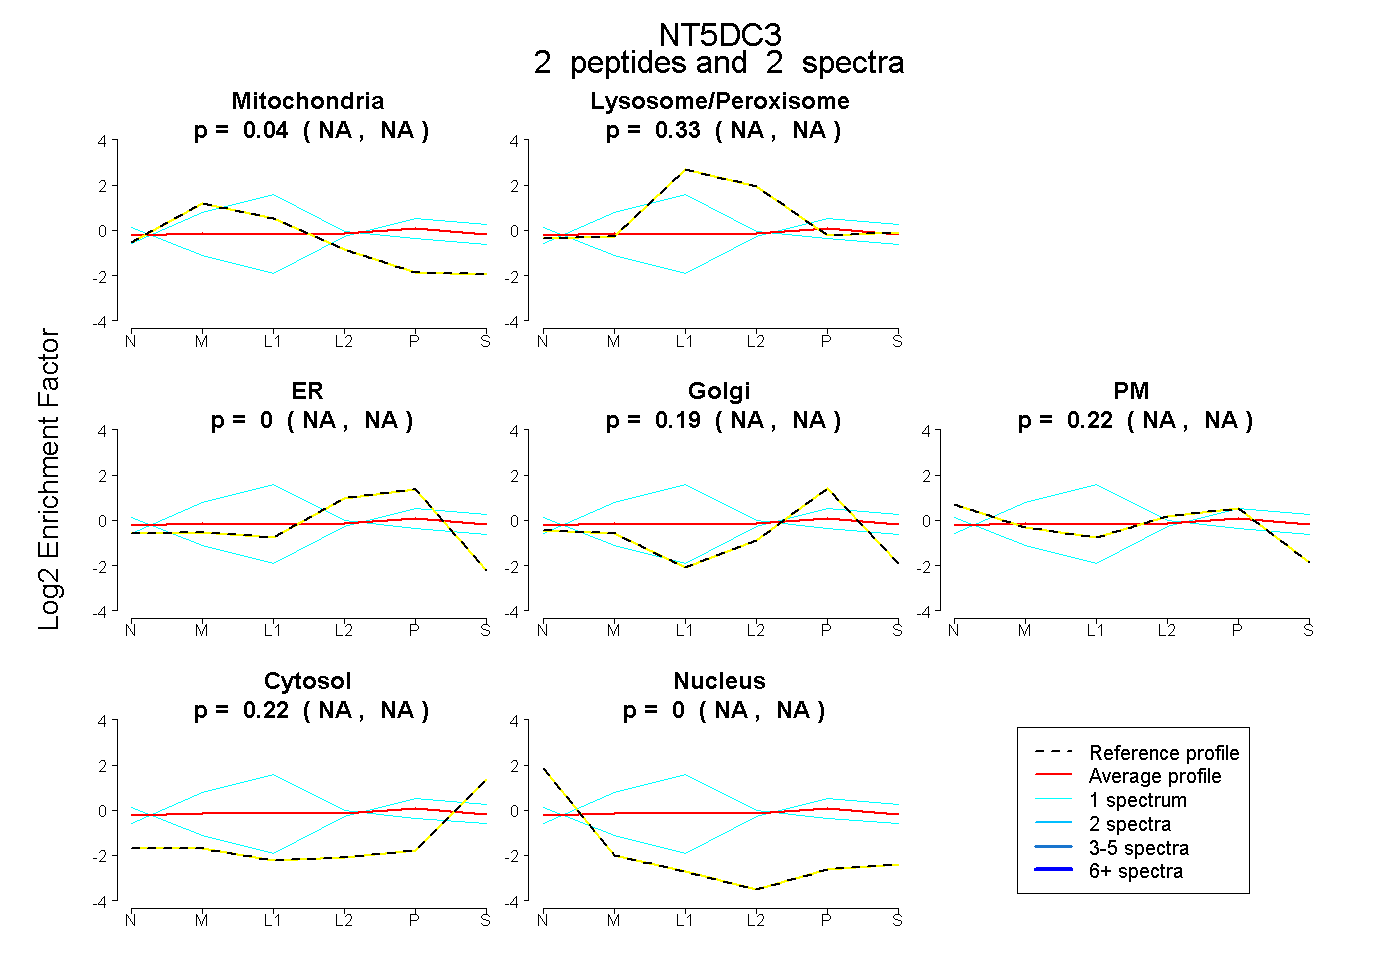
NA | NA
NA | NA
NA | NA
NA | NA
NA | NA
NA | NA
NA | NA
6peptides
spectra
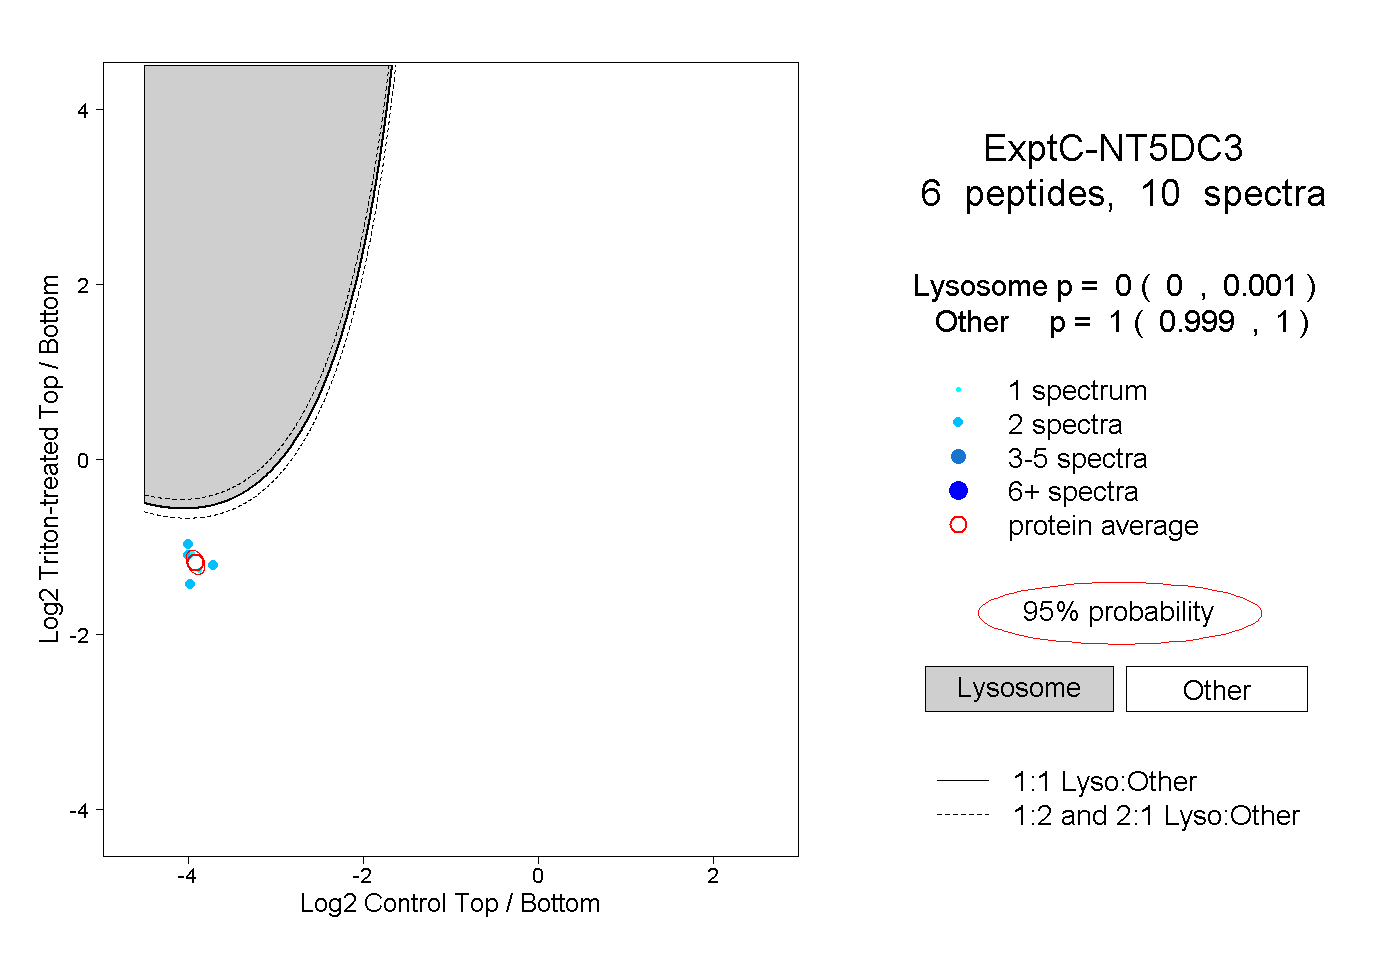
0.000 | 0.001
0.999 | 1.000