 1
1peptide
spectra
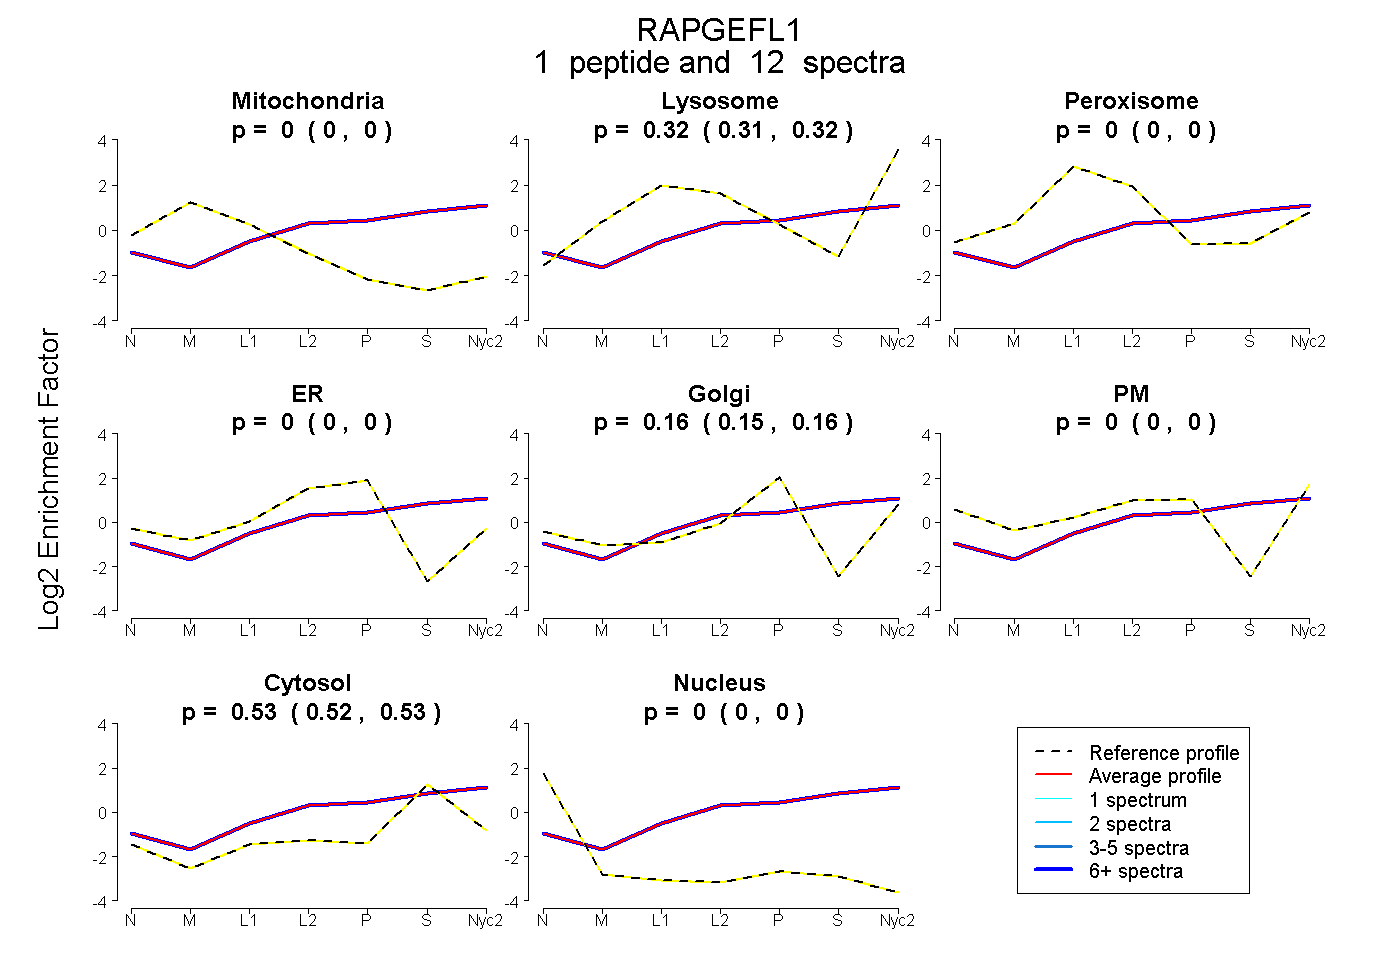
0.000 | 0.000
0.310 | 0.320
0.000 | 0.000
0.000 | 0.000
0.154 | 0.164
0.000 | 0.000
0.521 | 0.529
0.000 | 0.000
3peptides
spectra
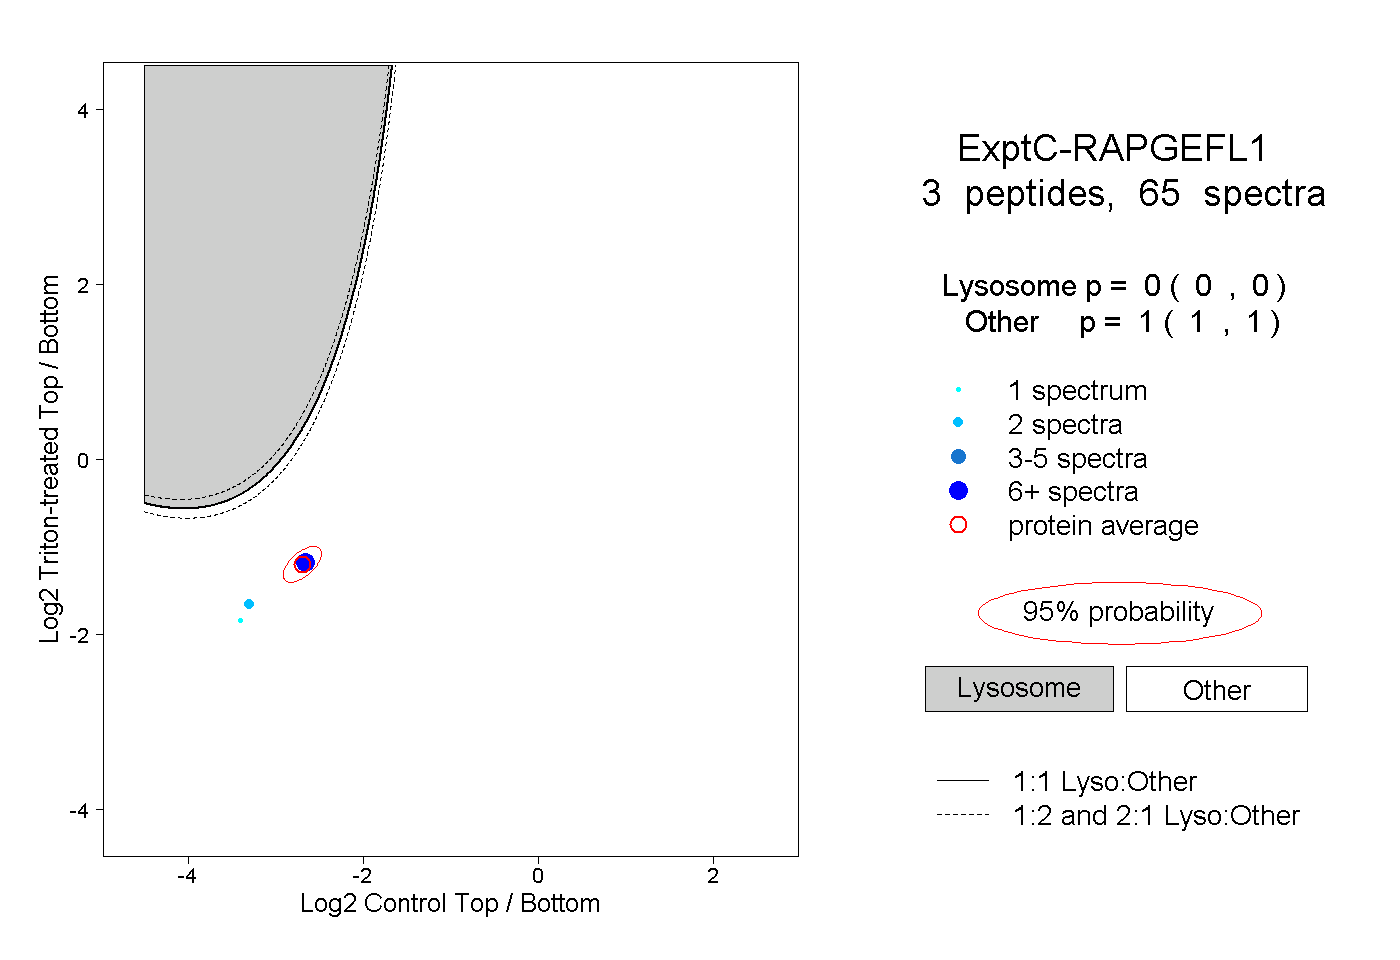
0.000 | 0.000
1.000 | 1.000
1peptide
spectra
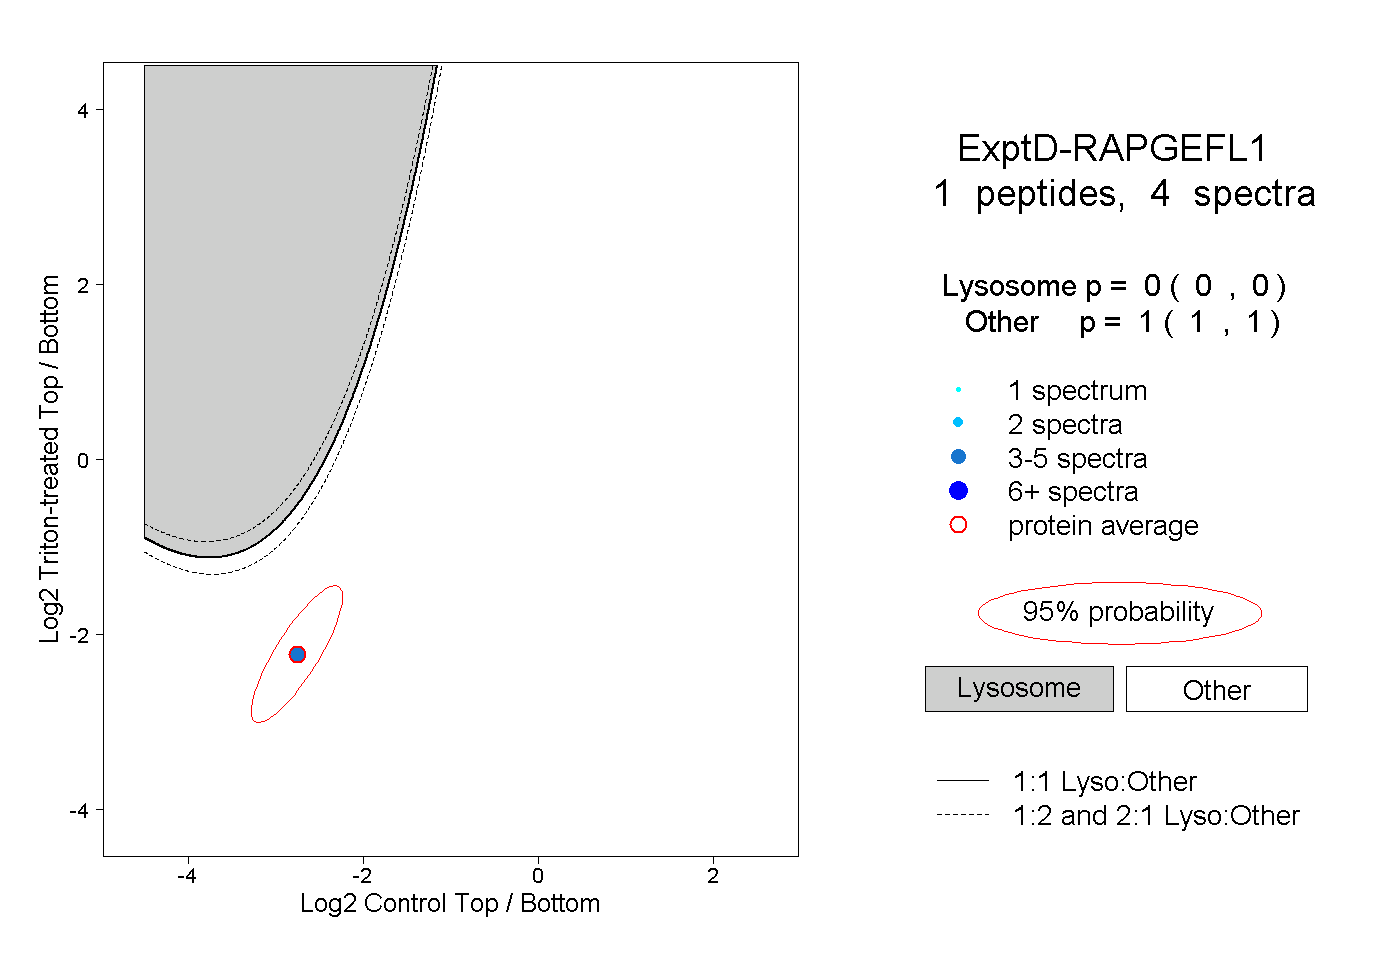
0.000 | 0.000
1.000 | 1.000