 2
2peptides
spectra
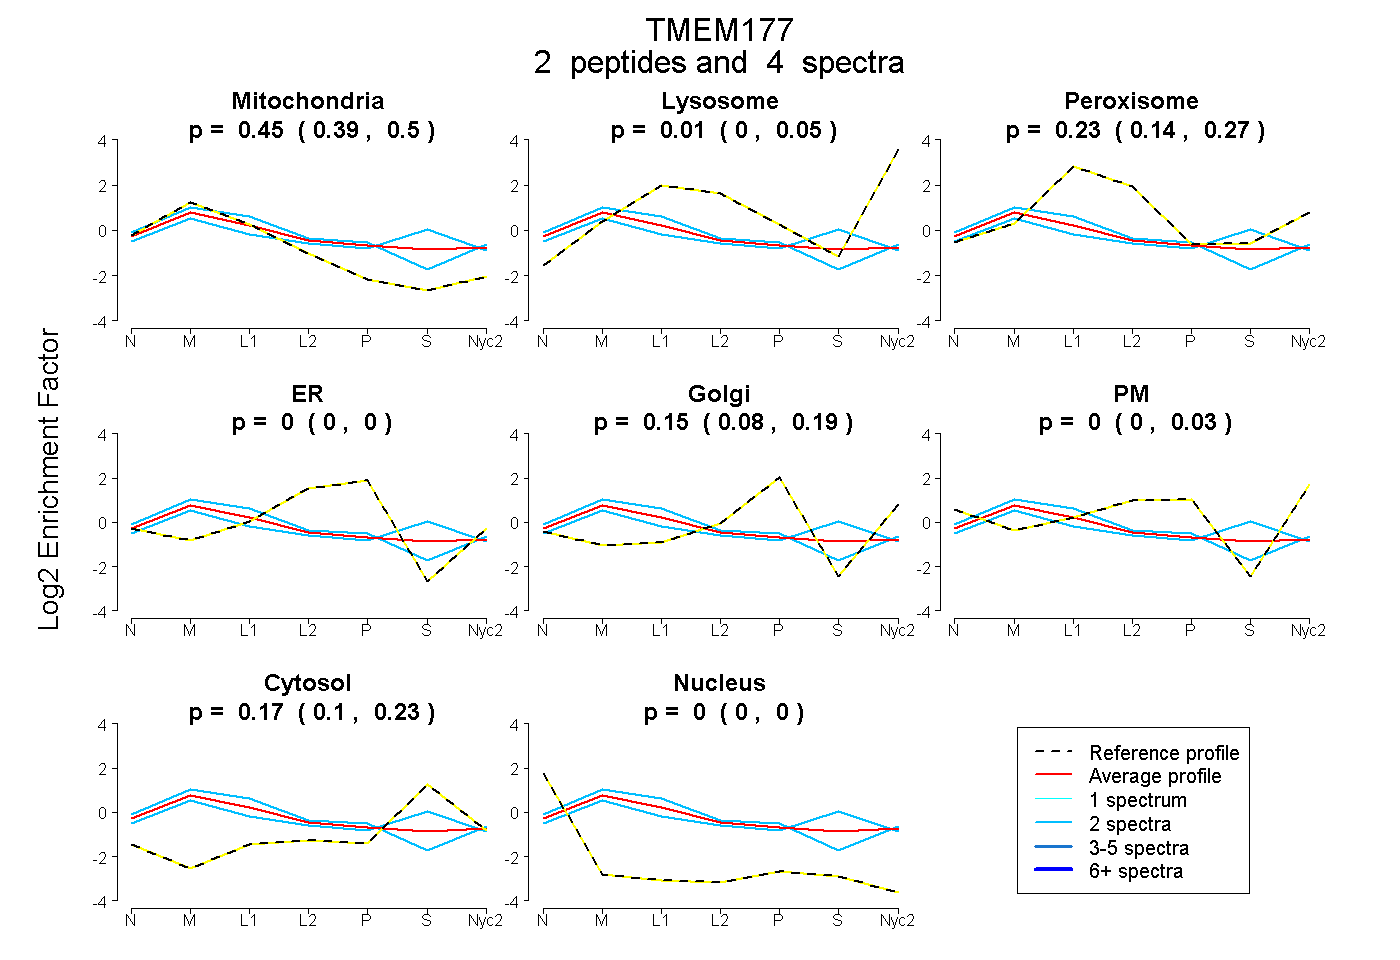
0.390 | 0.502
0.000 | 0.051
0.138 | 0.272
0.000 | 0.000
0.084 | 0.189
0.000 | 0.027
0.102 | 0.233
0.000 | 0.000
4peptides
spectra
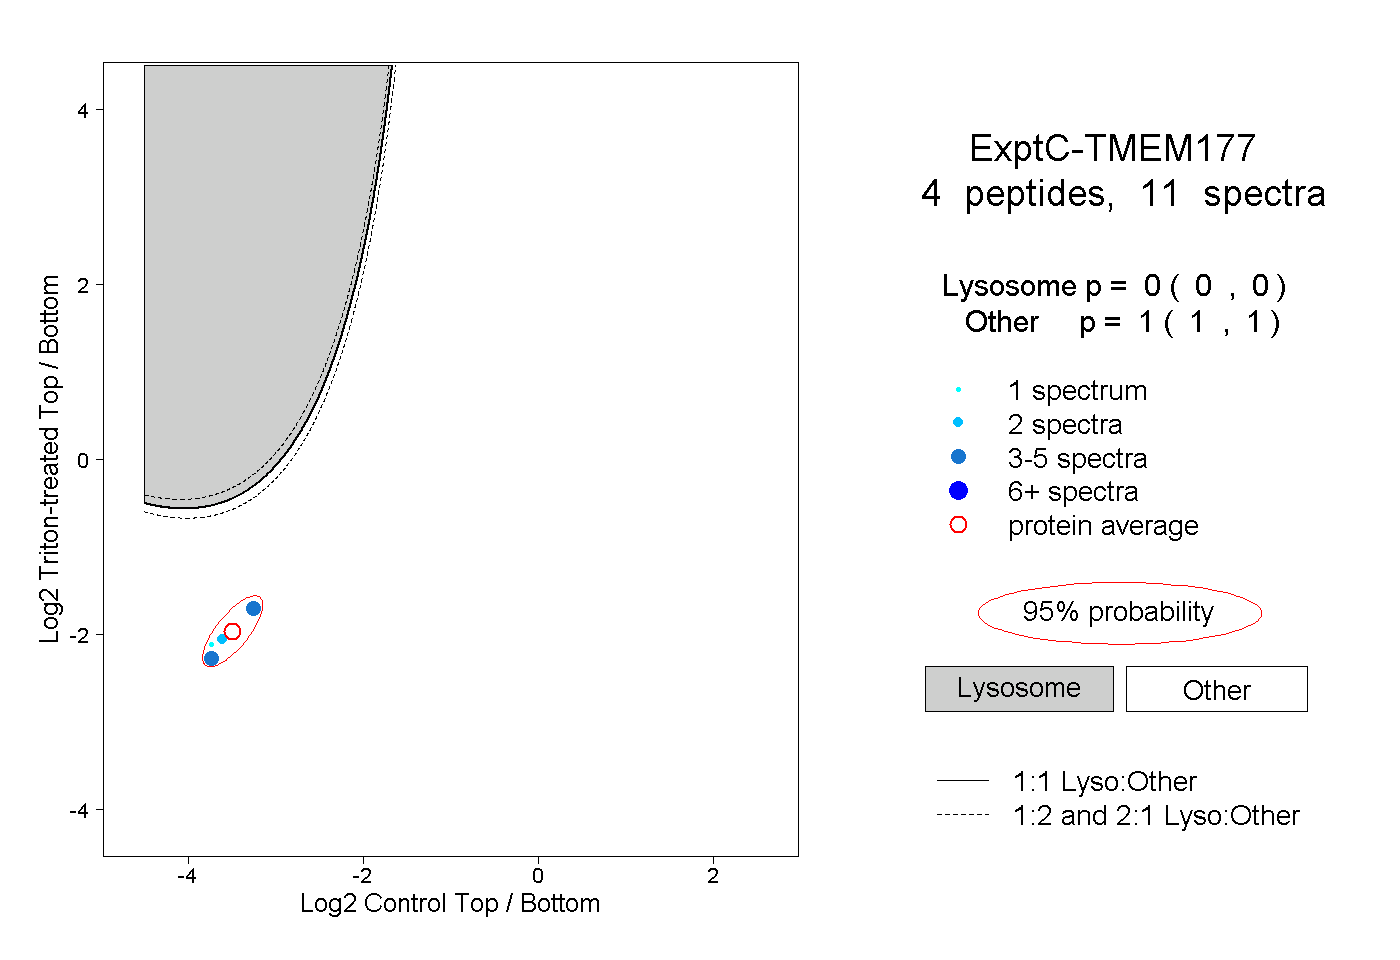
0.000 | 0.000
1.000 | 1.000
1peptide
spectrum
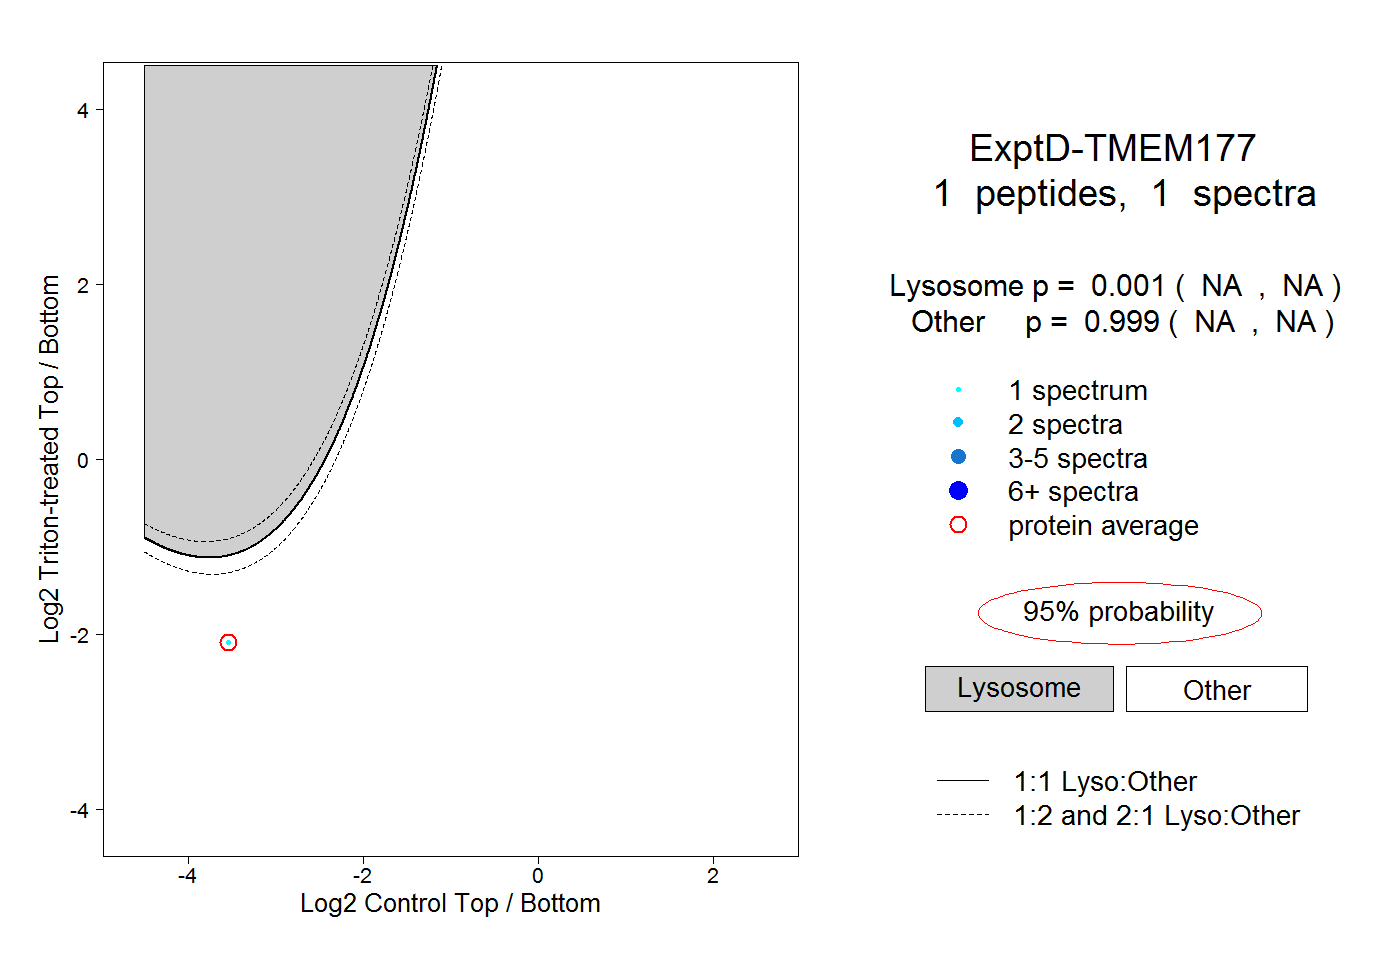
NA | NA
NA | NA