 1
1peptide
spectra
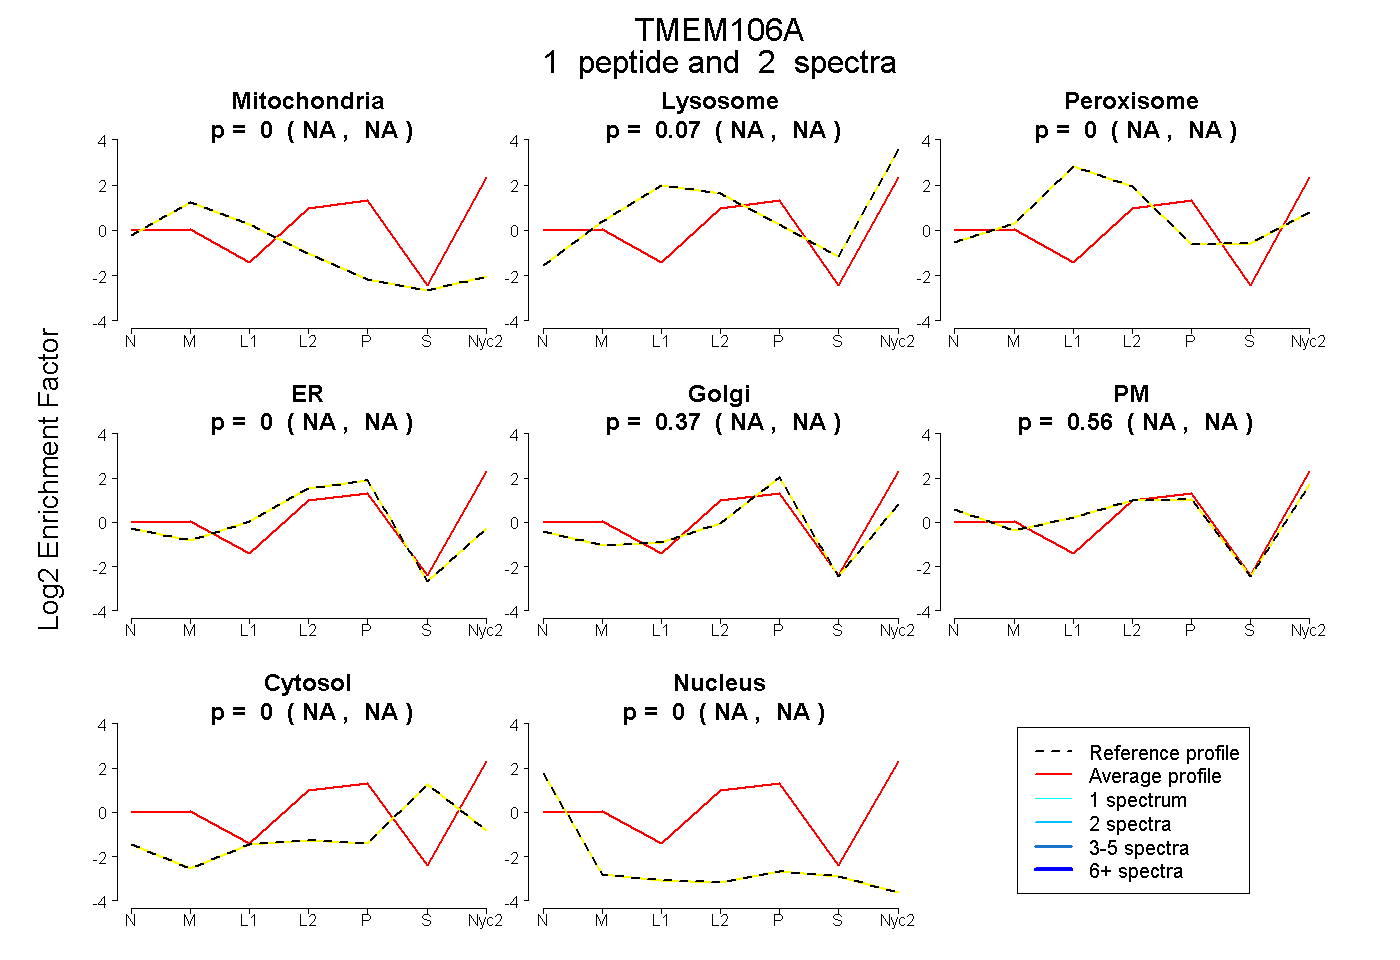
NA | NA
NA | NA
NA | NA
NA | NA
NA | NA
NA | NA
NA | NA
NA | NA
5peptides
spectra
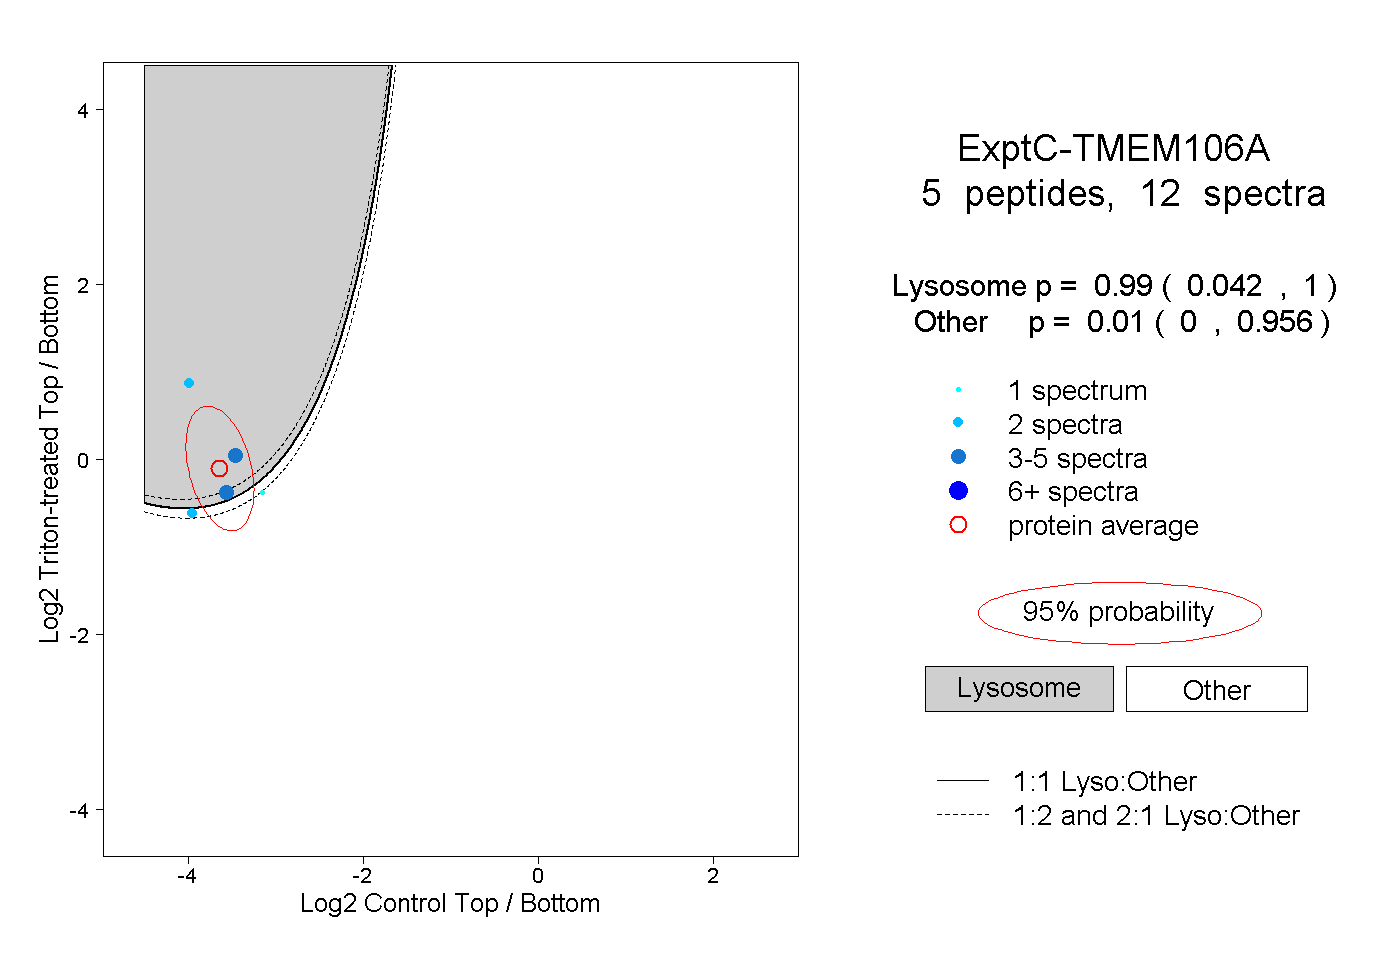
0.042 | 1.000
0.000 | 0.956
| Plot | Mito | Lyso | Perox | ER | Golgi | PM | Cytosol | Nucleus | |||||
| Expt A |
1 peptide |
2 spectra |
|
0.000 NA | NA |
0.069 NA | NA |
0.000 NA | NA |
0.000 NA | NA |
0.369 NA | NA |
0.562 NA | NA |
0.000 NA | NA |
0.000 NA | NA |
||
| Plot | Lyso | Other | |||||||||||
| Expt C |
5 peptides |
12 spectra |
|
0.990 0.042 | 1.000 |
0.010 0.000 | 0.956 |
| 2 spectra, ICTWPK | 0.324 | 0.676 | ||||||||
| 2 spectra, ILDENTYK | 1.000 | 0.000 | ||||||||
| 3 spectra, QMPYEVASR | 0.995 | 0.005 | ||||||||
| 4 spectra, LHIGPLASK | 0.754 | 0.246 | ||||||||
| 1 spectrum, AANYFSTGNR | 0.176 | 0.824 |