AP1G2
[ENSRNOP00000036180]
Main page
| | | Plot |
Mito |
Lyso |
|
Perox |
ER |
Golgi |
PM |
Cytosol |
Nucleus |
|
| Expt A |
 6
6
peptides |
15
spectra |
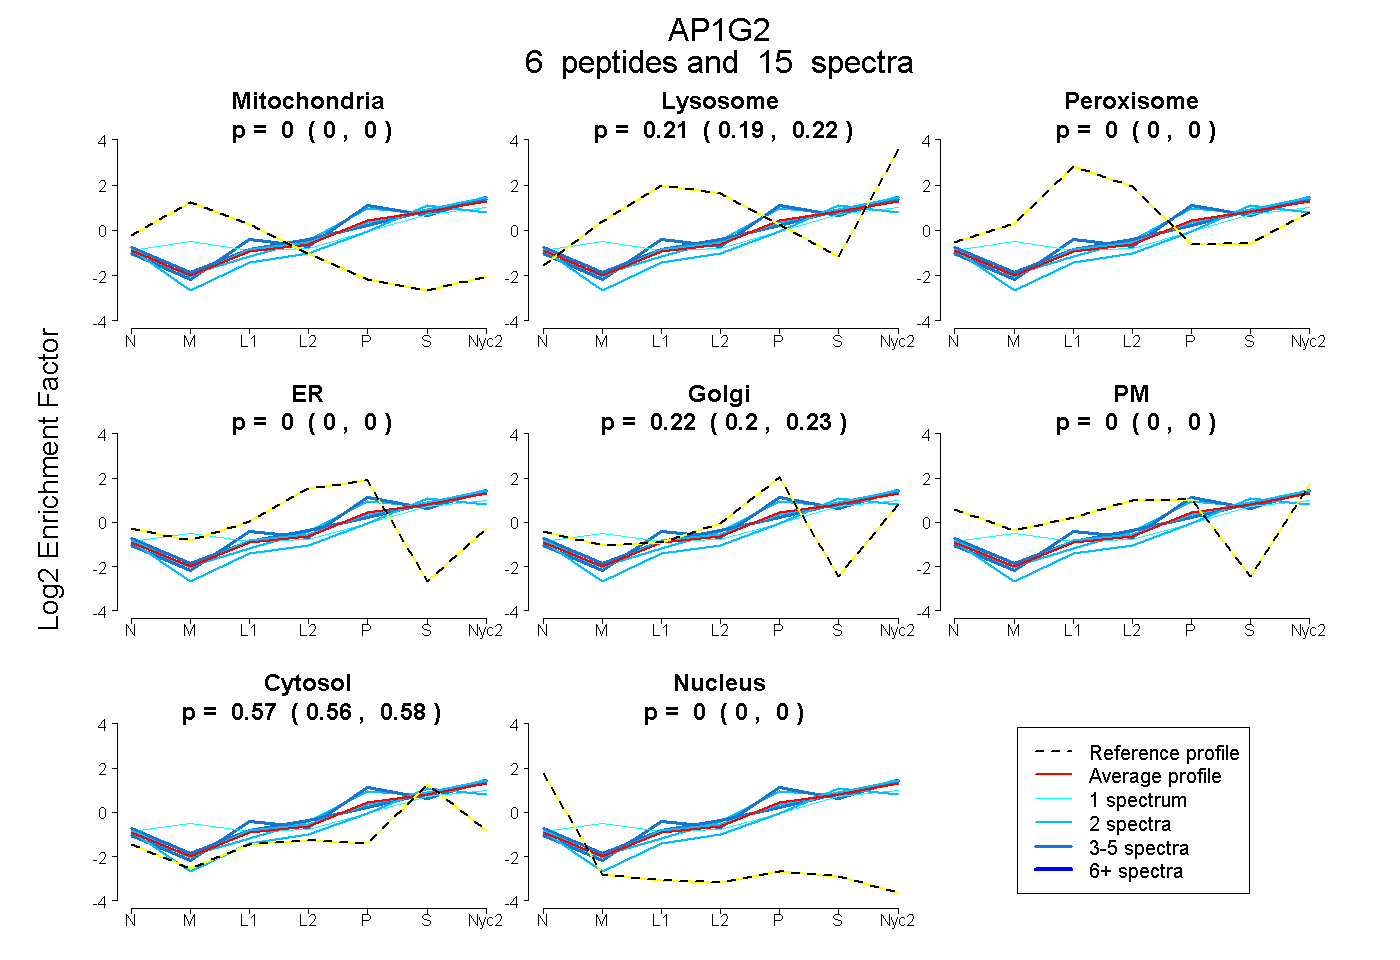 |
0.000
0.000 | 0.000 |
0.208
0.194 | 0.219 |
|
0.000
0.000 | 0.000 |
0.000
0.000 | 0.000 |
0.217
0.198 | 0.234 |
0.000
0.000 | 0.000 |
0.574
0.562 | 0.585 |
0.000
0.000 | 0.000 |
|
| | | Plot |
Mito |
|
Lyso or Perox |
|
ER |
Golgi |
PM |
Cytosol |
Nucleus |
|
| Expt B |
1
peptide |
1
spectrum |
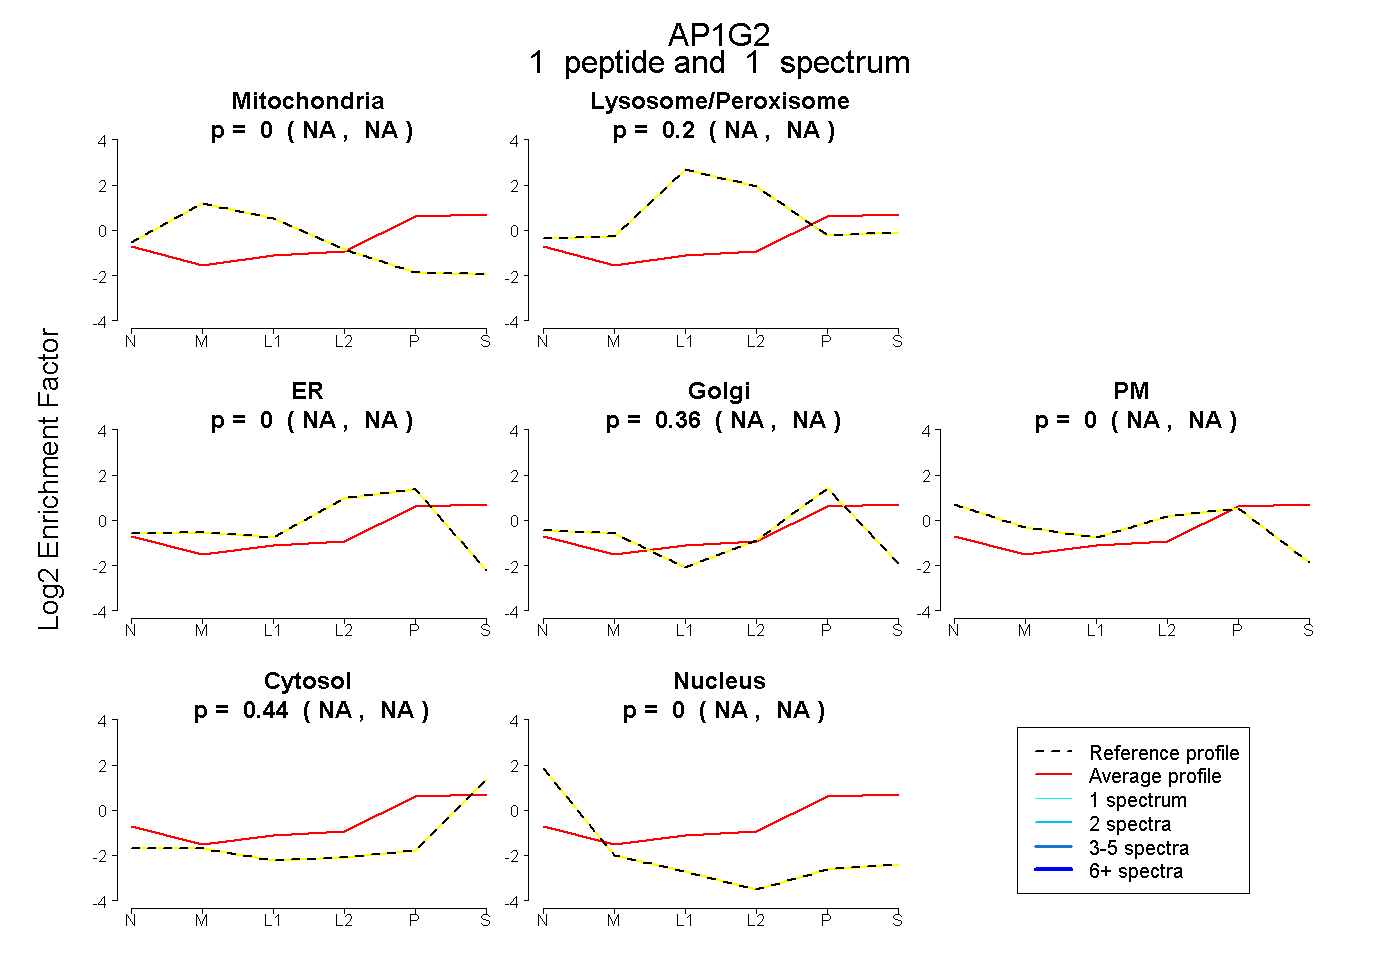 |
0.000
NA | NA |
|
0.198
NA | NA |
|
0.000
NA | NA |
0.362
NA | NA |
0.000
NA | NA |
0.440
NA | NA |
0.000
NA | NA |
|
| | | Plot |
|
Lyso |
|
|
|
|
|
|
|
Other |
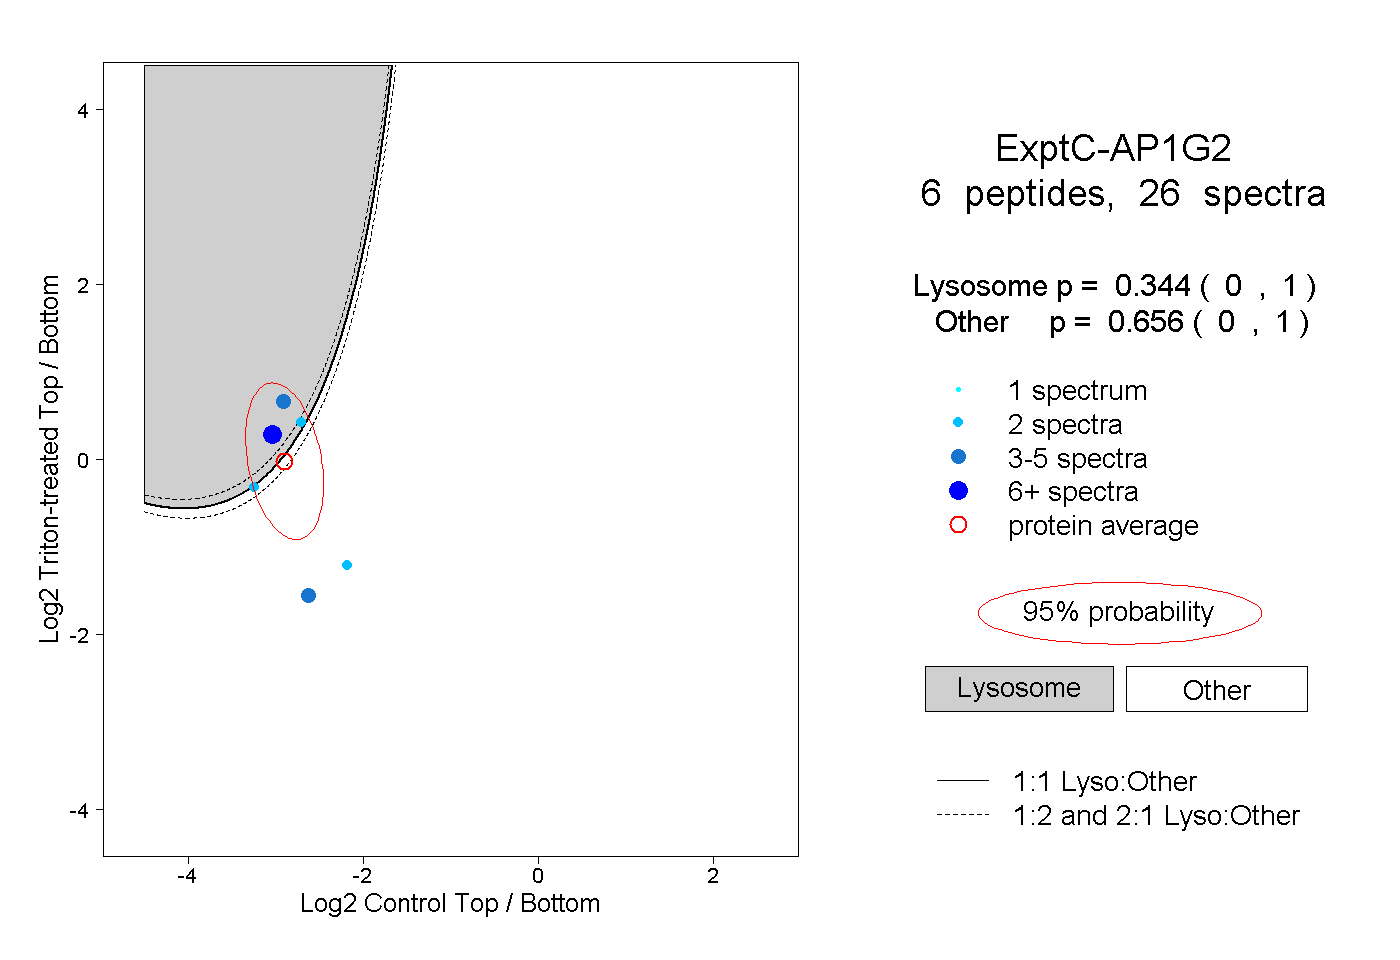
| Expt C |
6
peptides |
26
spectra |
 |
|
0.344
0.000 | 1.000 |
|
|
|
|
|
|
|
0.656
0.000 | 1.000 |
| 2 spectra, DGDPLQR |
|
0.448 |
|
|
|
|
|
|
|
0.552 |
| 13 spectra, GYAITALMK |
|
0.978 |
|
|
|
|
|
|
|
0.022 |
| 3 spectra, VPSLK |
|
0.000 |
|
|
|
|
|
|
|
1.000 |
| 2 spectra, ILNPNK |
|
0.000 |
|
|
|
|
|
|
|
1.000 |
| 2 spectra, LQDLIEEIR |
|
0.695 |
|
|
|
|
|
|
|
0.305 |
| 4 spectra, FLLNNDK |
|
0.997 |
|
|
|
|
|
|
|
0.003 |
| | | Plot |
|
Lyso |
|
|
|
|
|
|
|
Other |
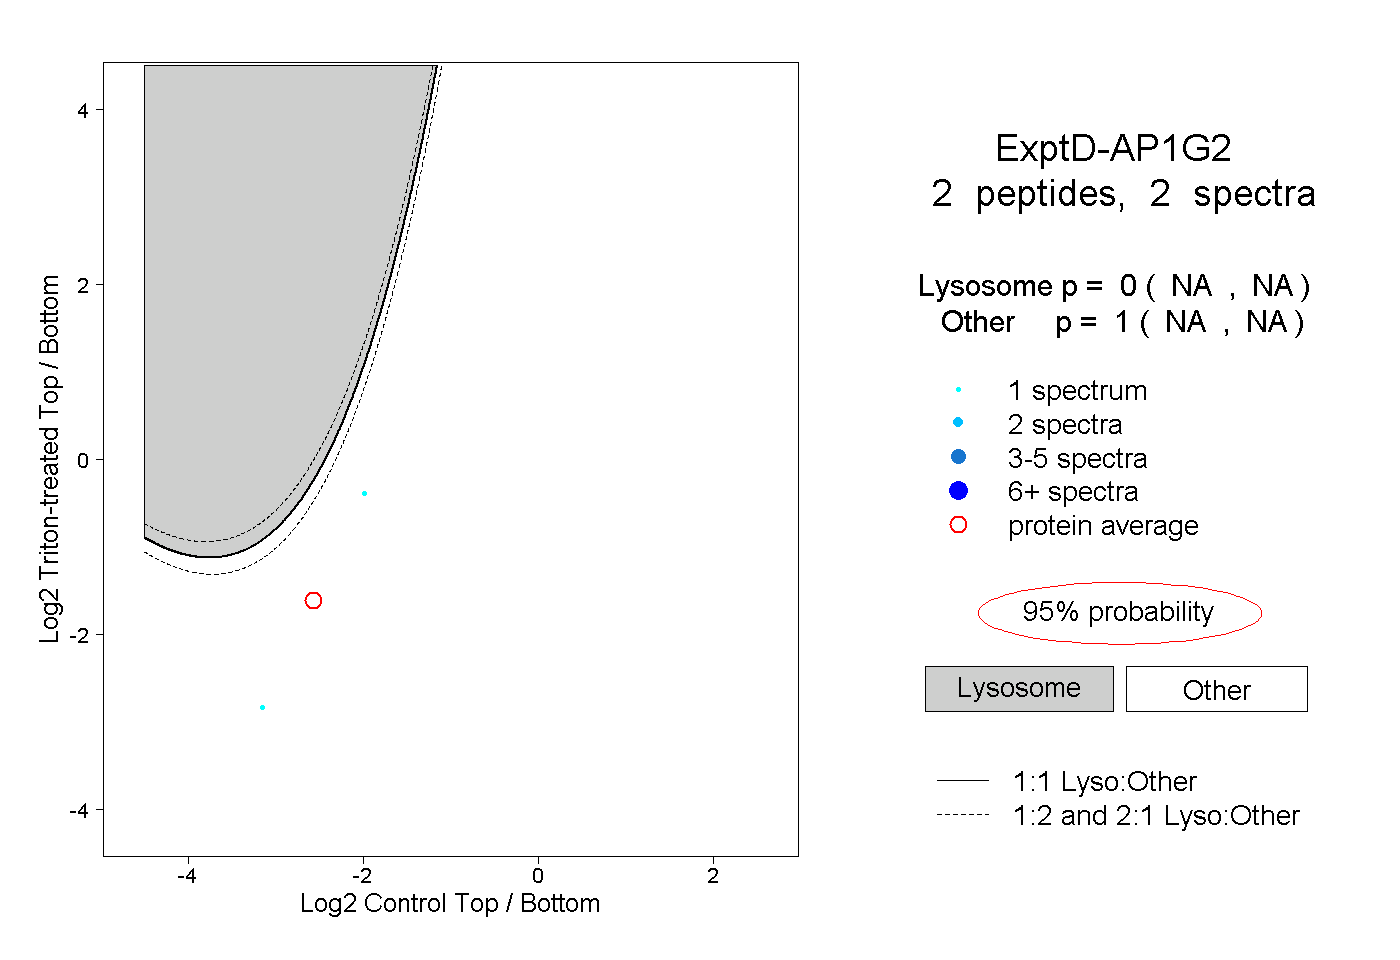
| Expt D |
2
peptides |
2
spectra |
 |
|
0.000
NA | NA |
|
|
|
|
|
|
|
1.000
NA | NA |