 6
6peptides
spectra
0.000 | 0.000
0.194 | 0.219
0.000 | 0.000
0.000 | 0.000
0.198 | 0.234
0.000 | 0.000
0.562 | 0.585
0.000 | 0.000
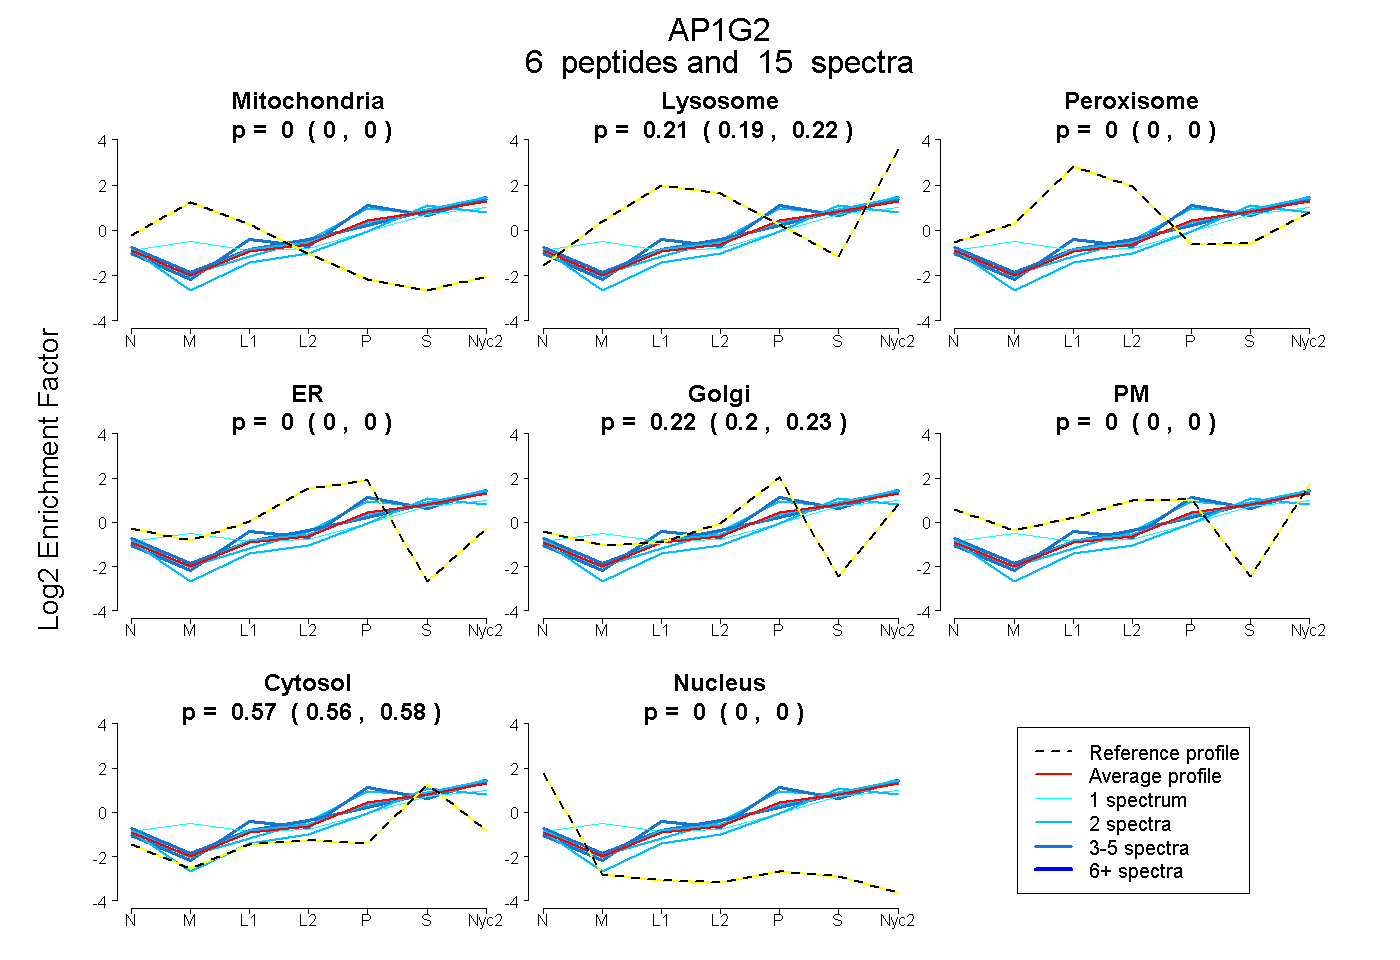
| Plot | Mito | Lyso | Perox | ER | Golgi | PM | Cytosol | Nucleus | |||||
| Expt A |
6 peptides |
15 spectra |
|
0.000 0.000 | 0.000 |
0.208 0.194 | 0.219 |
0.000 0.000 | 0.000 |
0.000 0.000 | 0.000 |
0.217 0.198 | 0.234 |
0.000 0.000 | 0.000 |
0.574 0.562 | 0.585 |
0.000 0.000 | 0.000 |
| 4 spectra, GYAITALMK | 0.000 | 0.222 | 0.000 | 0.000 | 0.295 | 0.000 | 0.482 | 0.000 | ||
| 1 spectrum, LFQQPSPYVR | 0.000 | 0.278 | 0.000 | 0.000 | 0.166 | 0.000 | 0.556 | 0.000 | ||
| 4 spectra, LQDLIEEIR | 0.000 | 0.257 | 0.000 | 0.000 | 0.169 | 0.000 | 0.573 | 0.000 | ||
| 2 spectra, FLLNNDK | 0.000 | 0.187 | 0.000 | 0.000 | 0.309 | 0.000 | 0.503 | 0.000 | ||
| 2 spectra, VLAVNILGR | 0.000 | 0.076 | 0.000 | 0.000 | 0.186 | 0.000 | 0.738 | 0.000 | ||
| 2 spectra, VVPQLVQILR | 0.000 | 0.240 | 0.000 | 0.000 | 0.182 | 0.000 | 0.578 | 0.000 |
| Plot | Mito | Lyso or Perox | ER | Golgi | PM | Cytosol | Nucleus | ||||||
| Expt B |
1 peptide |
1 spectrum |
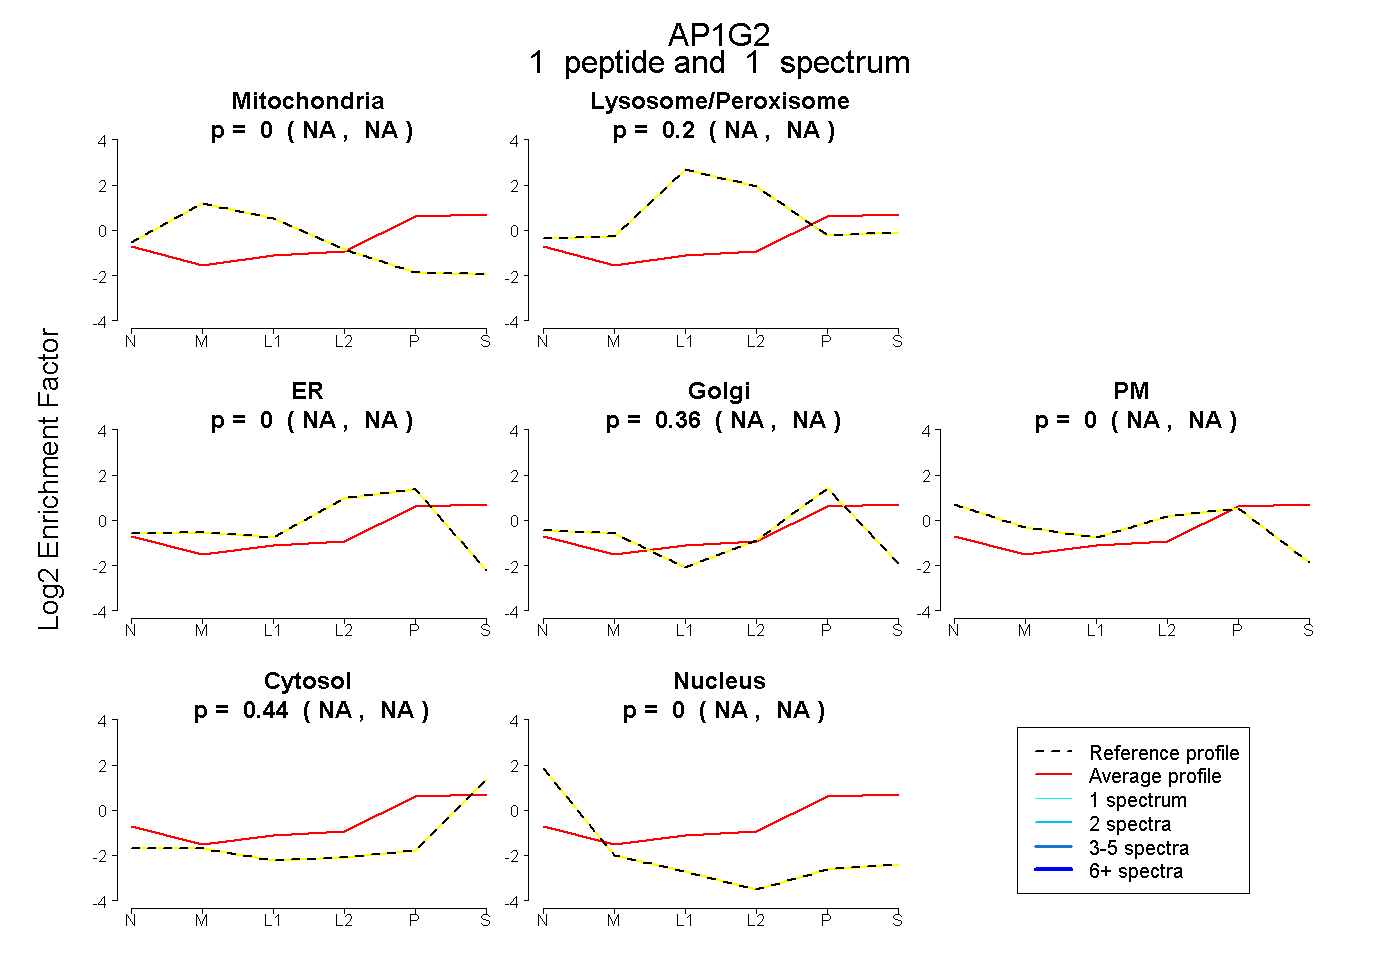 |
0.000 NA | NA |
0.198 NA | NA |
0.000 NA | NA |
0.362 NA | NA |
0.000 NA | NA |
0.440 NA | NA |
0.000 NA | NA |
|||
| Plot | Lyso | Other | |||||||||||
| Expt C |
6 peptides |
26 spectra |
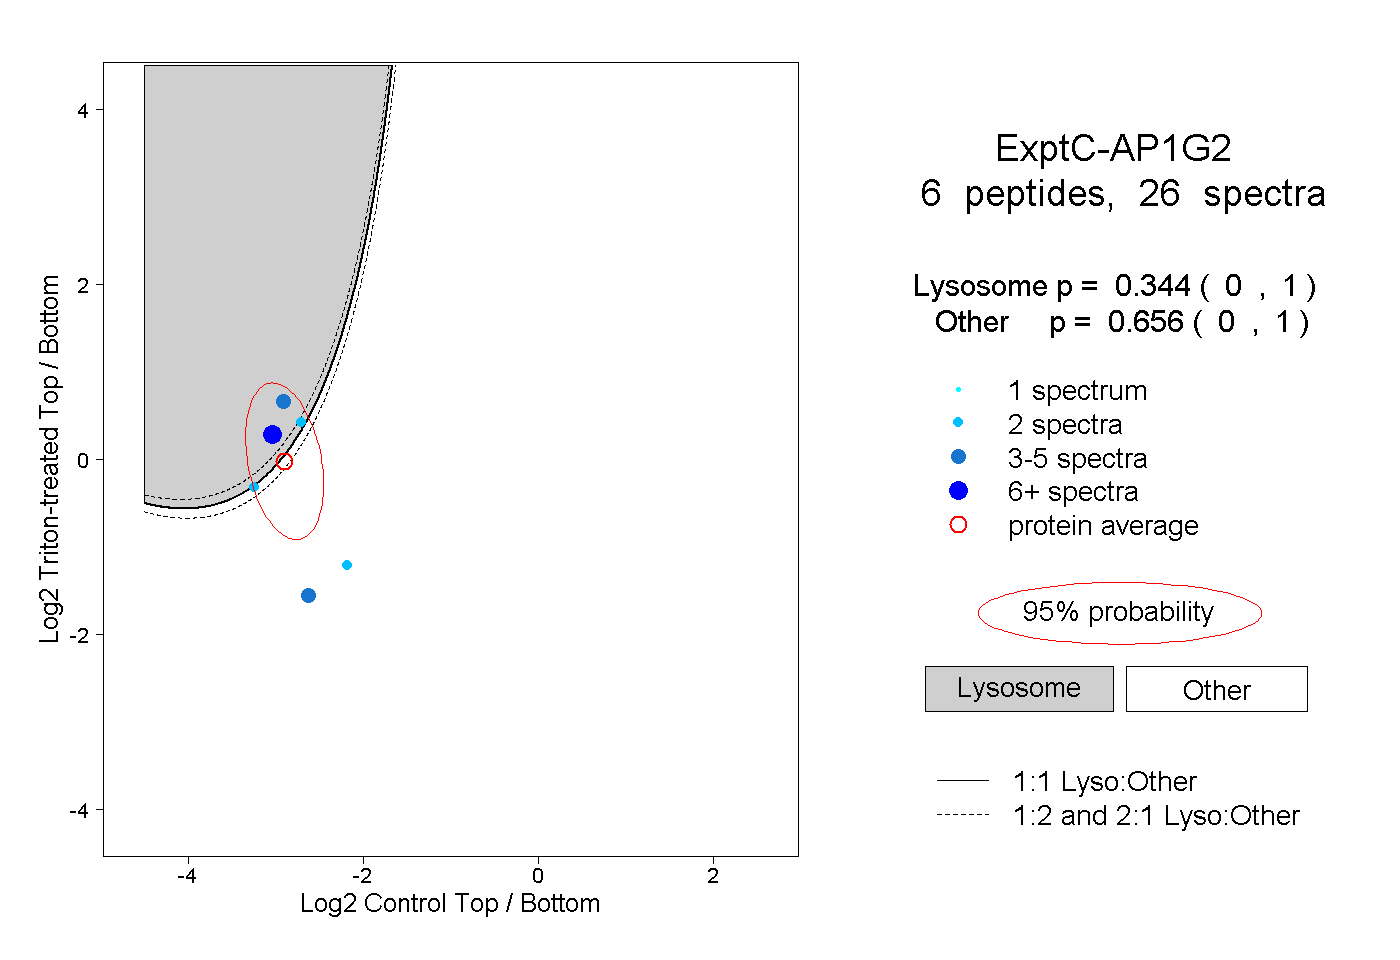 |
0.344 0.000 | 1.000 |
0.656 0.000 | 1.000 |
||||||||
| Plot | Lyso | Other | |||||||||||
| Expt D |
2 peptides |
2 spectra |
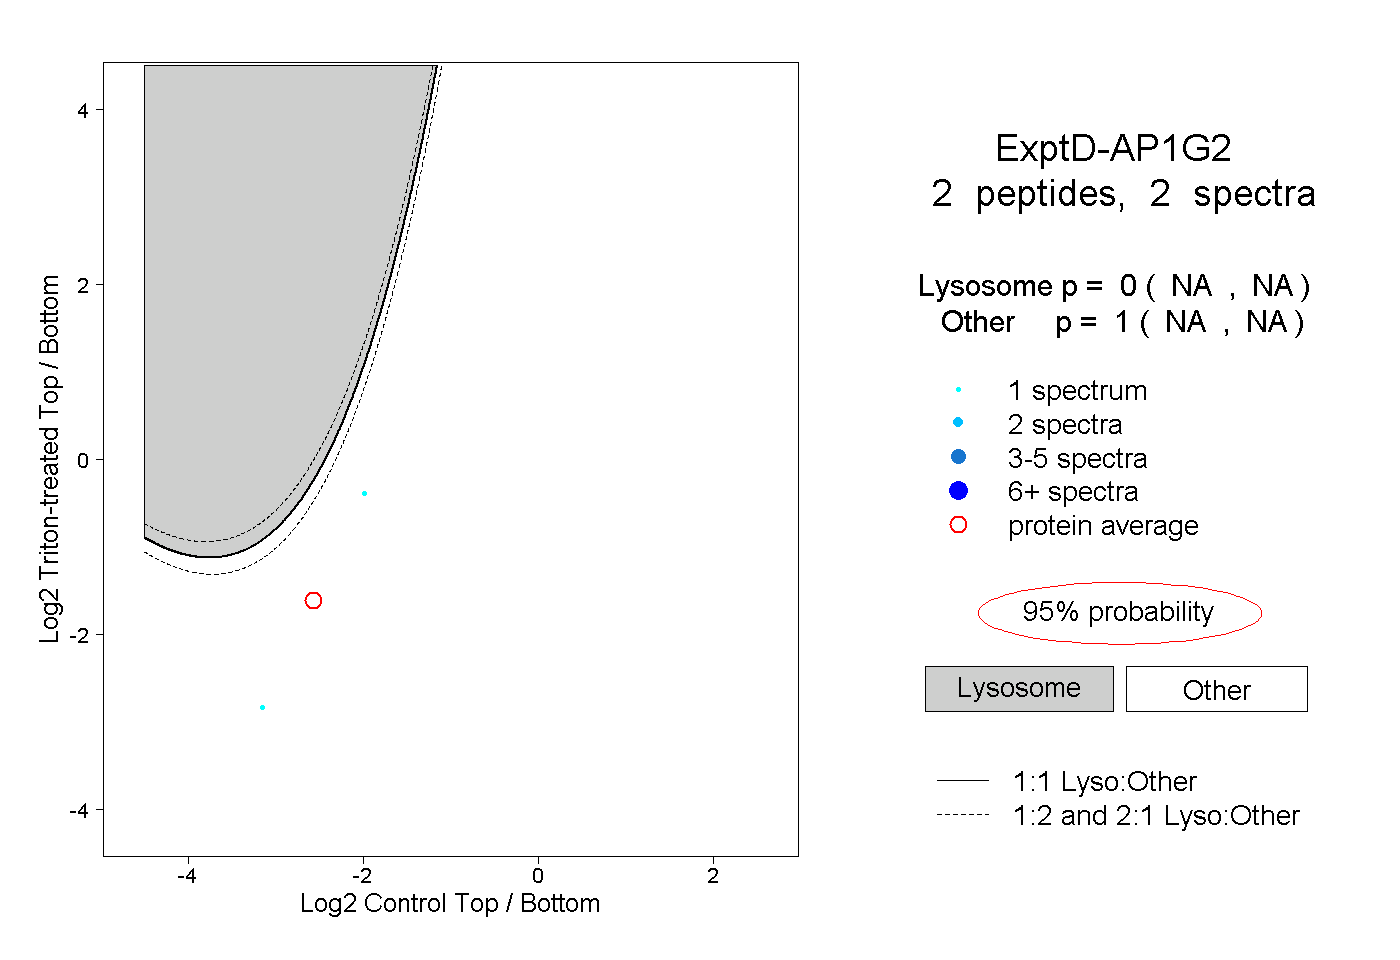 |
0.000 NA | NA |
1.000 NA | NA |