 6
6peptides
spectra
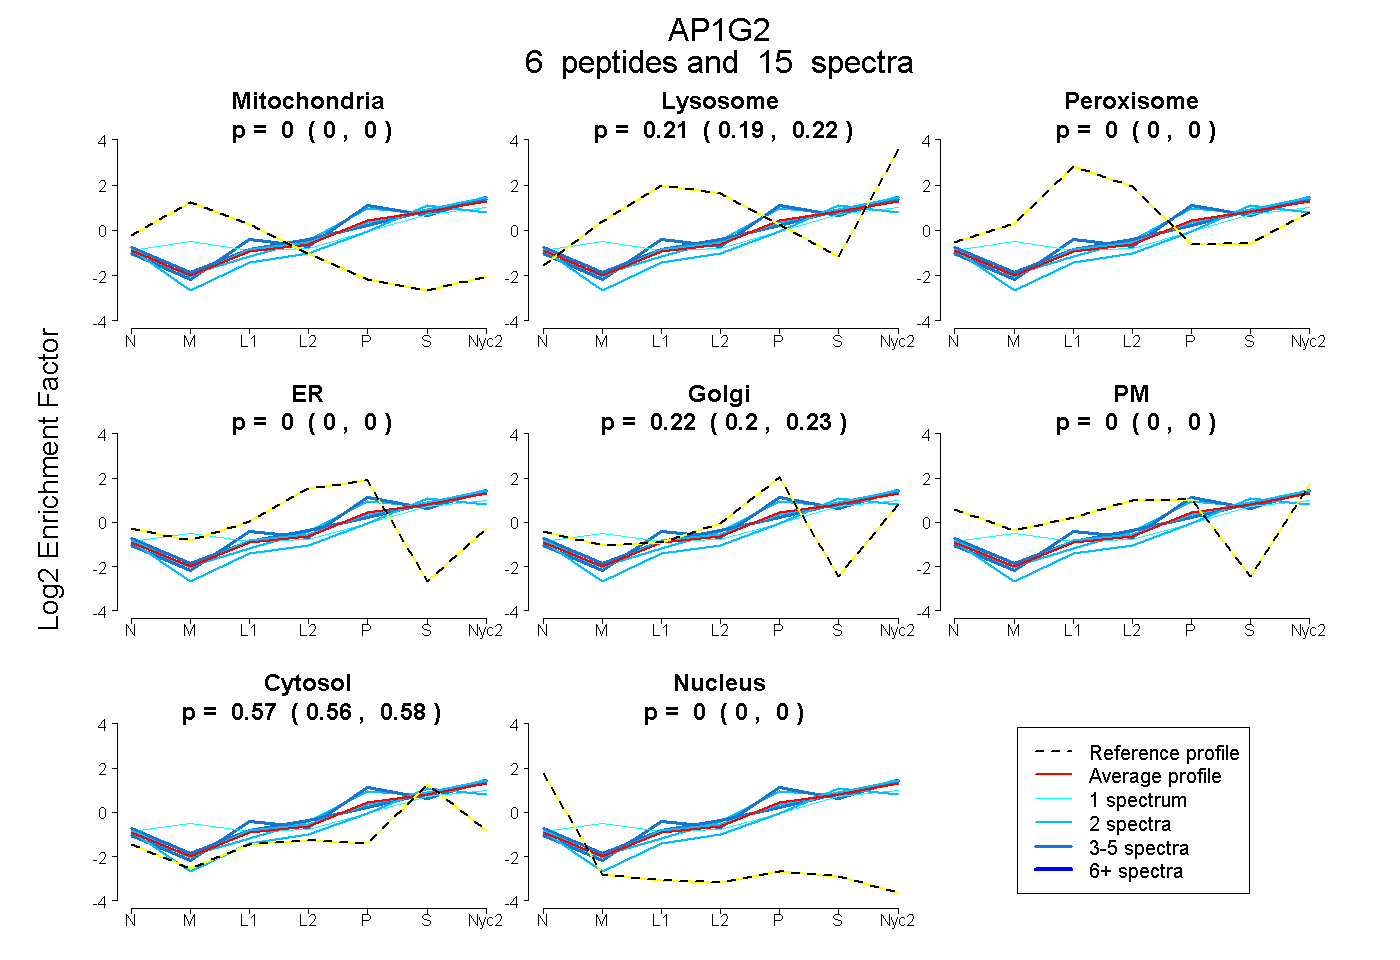
0.000 | 0.000
0.194 | 0.219
0.000 | 0.000
0.000 | 0.000
0.198 | 0.234
0.000 | 0.000
0.562 | 0.585
0.000 | 0.000
1peptide
spectrum
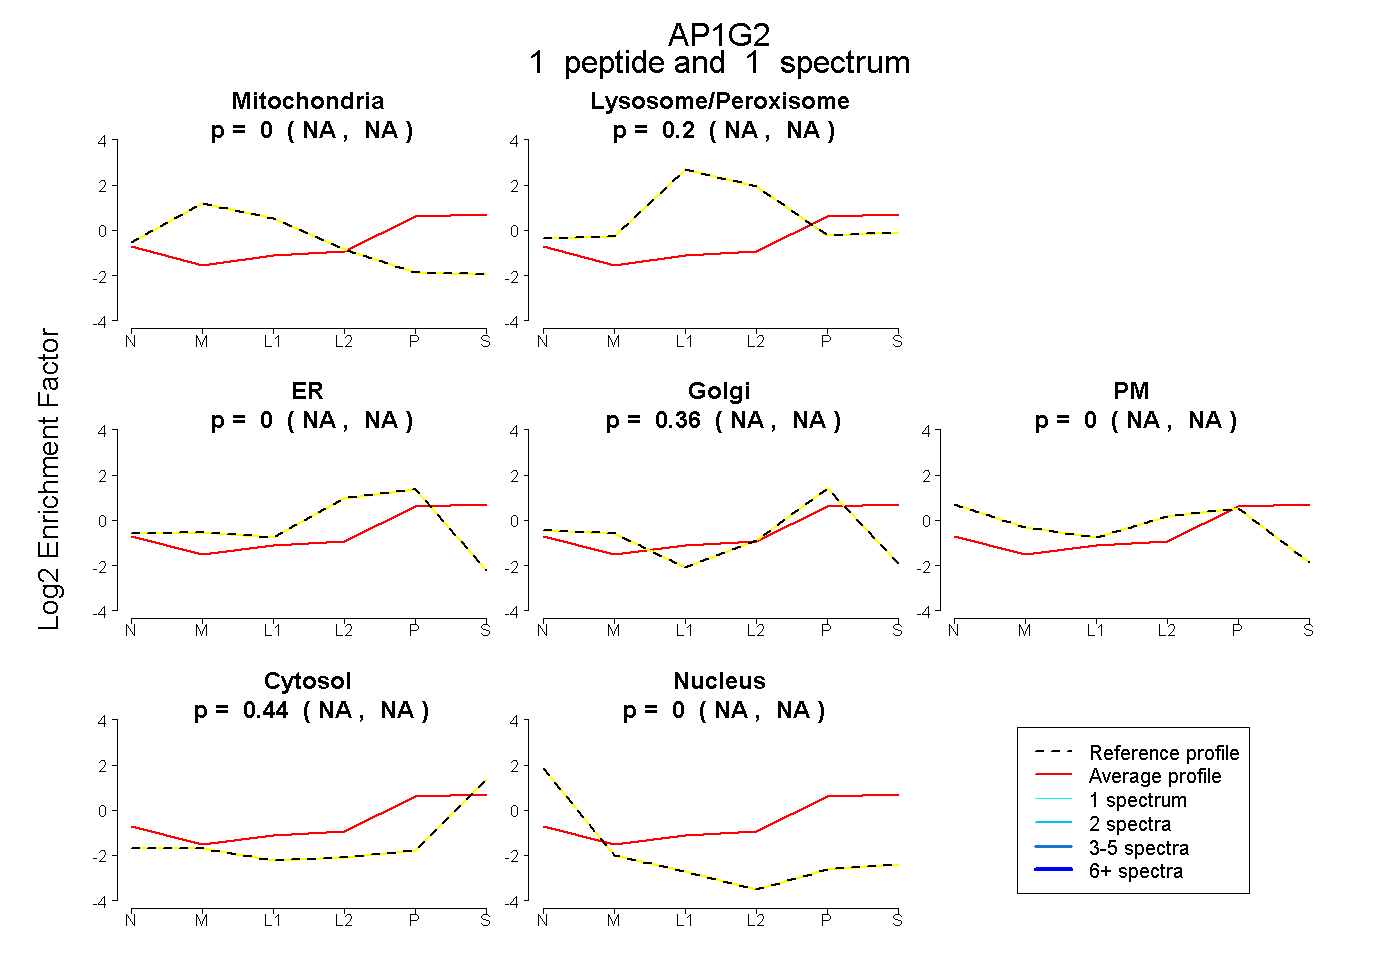
NA | NA
NA | NA
NA | NA
NA | NA
NA | NA
NA | NA
NA | NA
6peptides
spectra
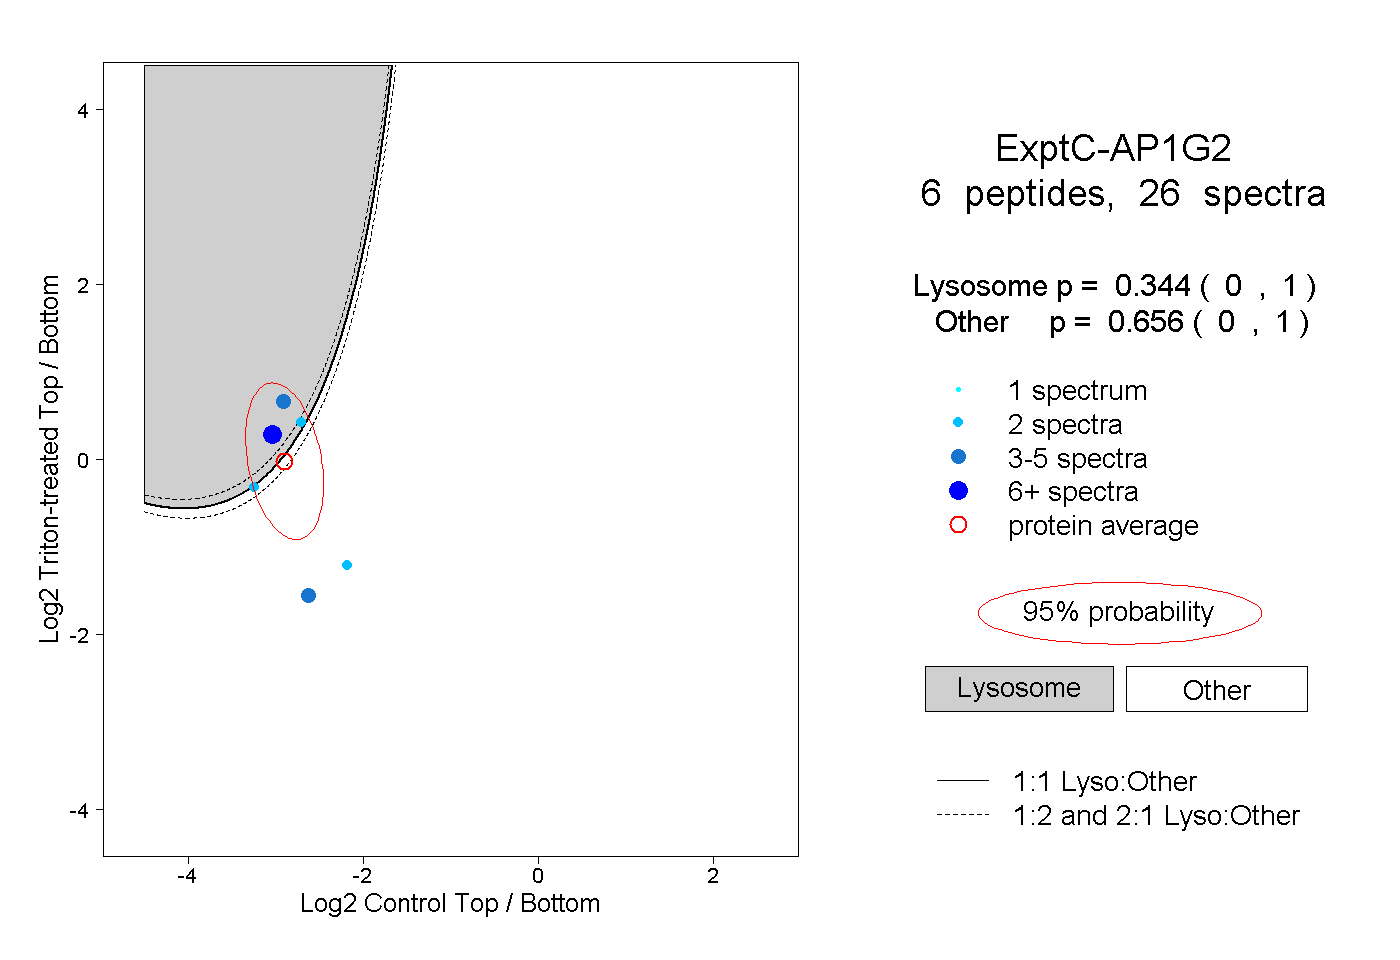
0.000 | 1.000
0.000 | 1.000
2peptides
spectra
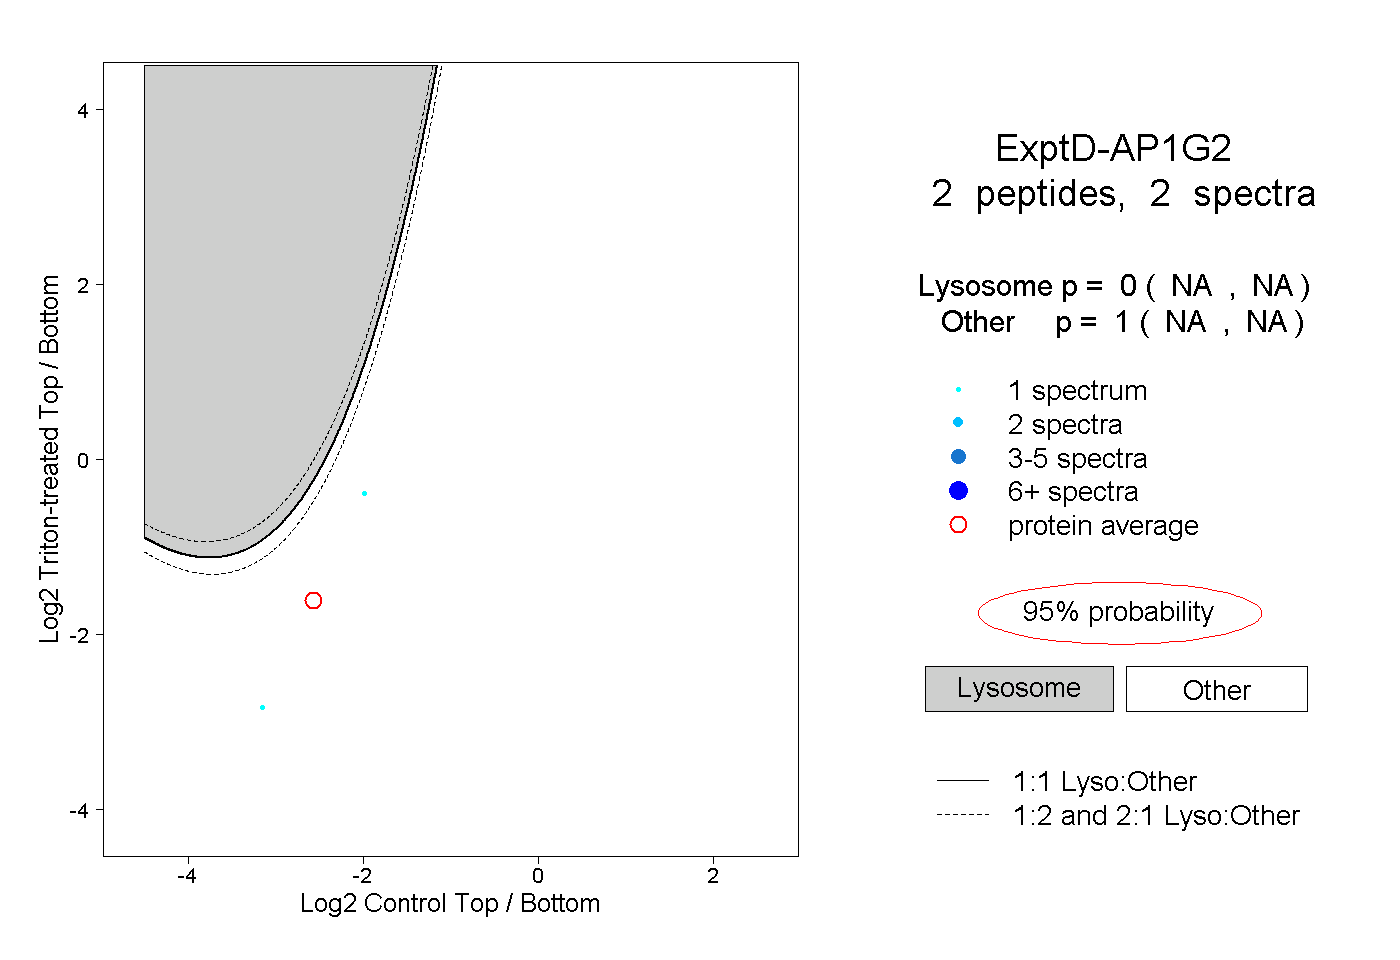
NA | NA
NA | NA