ABHD15
[ENSRNOP00000036157]
Main page
| | | Plot |
Mito |
Lyso |
|
Perox |
ER |
Golgi |
PM |
Cytosol |
Nucleus |
|
| Expt A |
 7
7
peptides |
13
spectra |
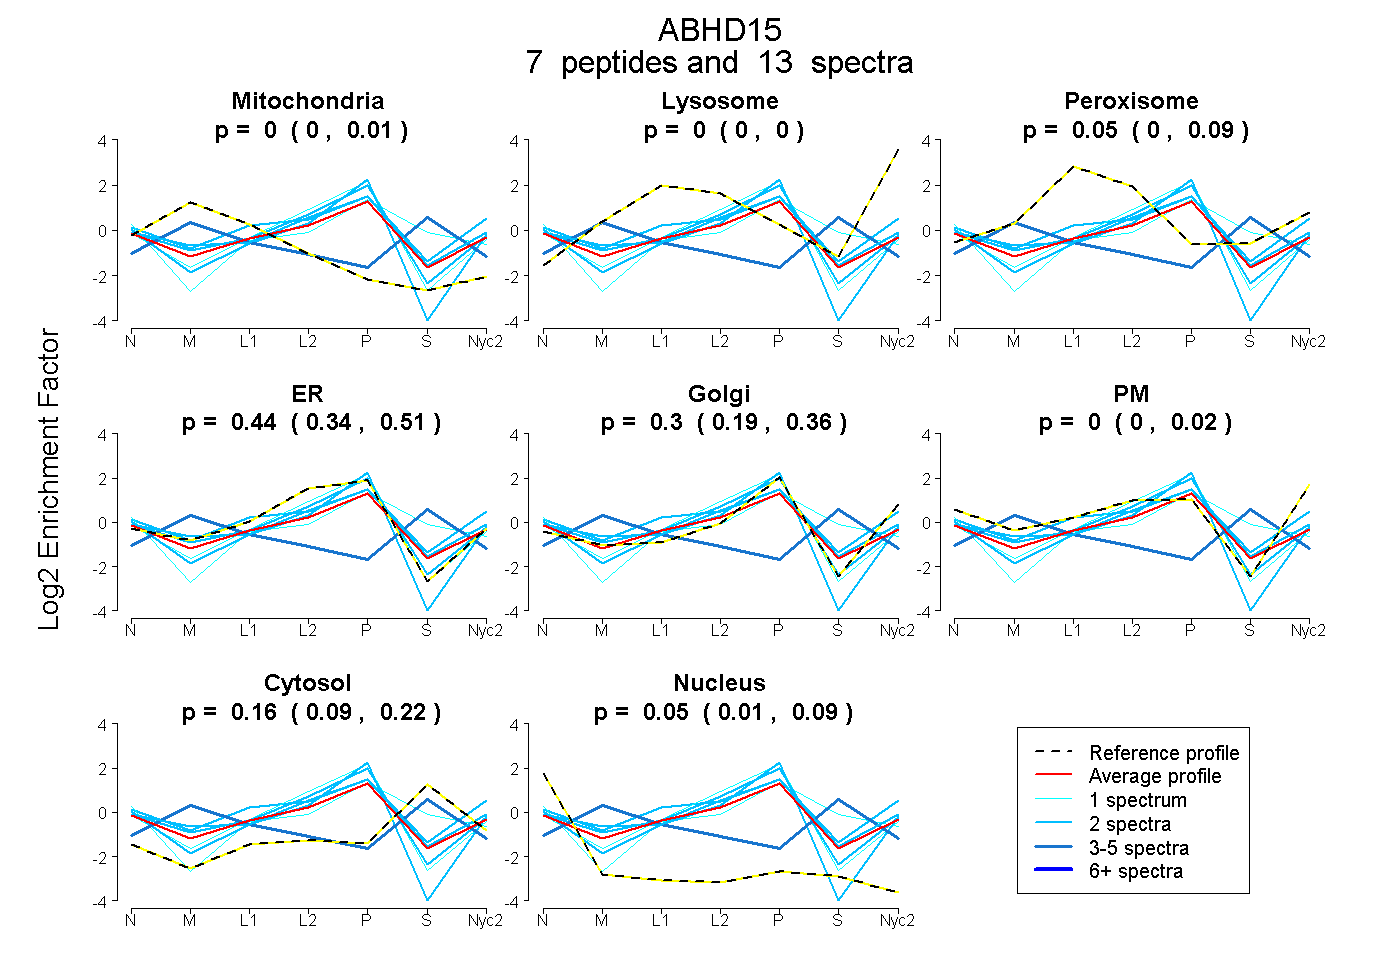 |
0.000
0.000 | 0.012 |
0.000
0.000 | 0.000 |
|
0.051
0.000 | 0.090 |
0.437
0.344 | 0.513 |
0.296
0.194 | 0.360 |
0.000
0.000 | 0.022 |
0.162
0.092 | 0.220 |
0.055
0.011 | 0.088 |
|
| | | Plot |
Mito |
|
Lyso or Perox |
|
ER |
Golgi |
PM |
Cytosol |
Nucleus |
|
| Expt B |
3
peptides |
4
spectra |
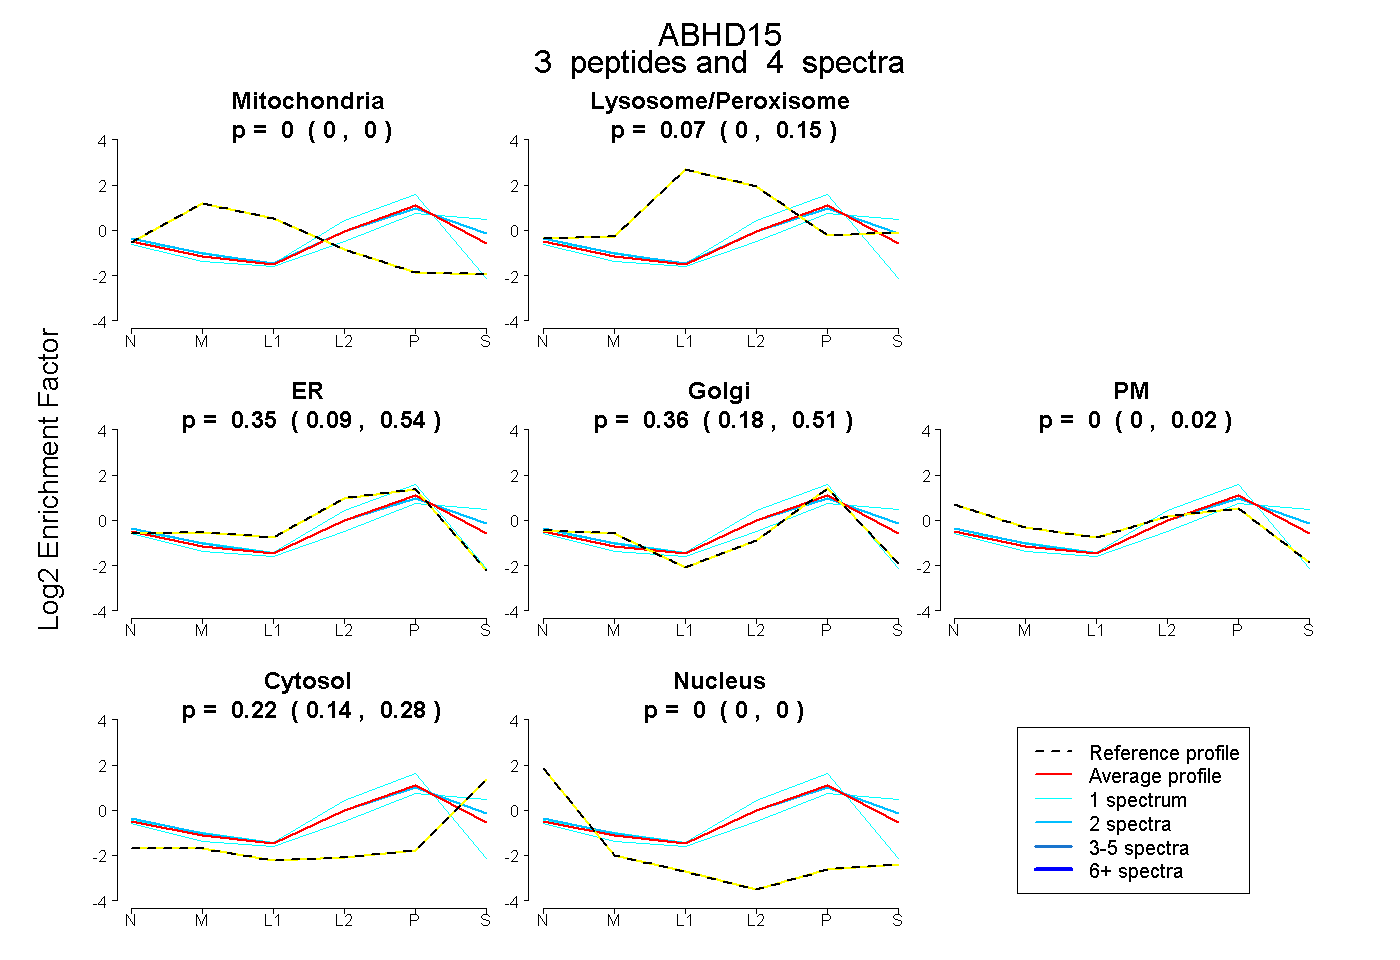 |
0.000
0.000 | 0.000 |
|
0.075
0.000 | 0.152 |
|
0.345
0.086 | 0.544 |
0.356
0.179 | 0.510 |
0.000
0.000 | 0.017 |
0.223
0.139 | 0.283 |
0.000
0.000 | 0.000 |
|
| 1 spectrum, TSFLGGR |
0.000 |
|
0.166 |
|
0.001 |
0.456 |
0.000 |
0.376 |
0.000 |
|
| 1 spectrum, ALTEFFR |
0.000 |
|
0.000 |
|
0.625 |
0.375 |
0.000 |
0.000 |
0.000 |
|
| 2 spectra, YASALEDTVDTGK |
0.000 |
|
0.157 |
|
0.165 |
0.439 |
0.000 |
0.238 |
0.000 |
|
| | | Plot |
|
Lyso |
|
|
|
|
|
|
|
Other |
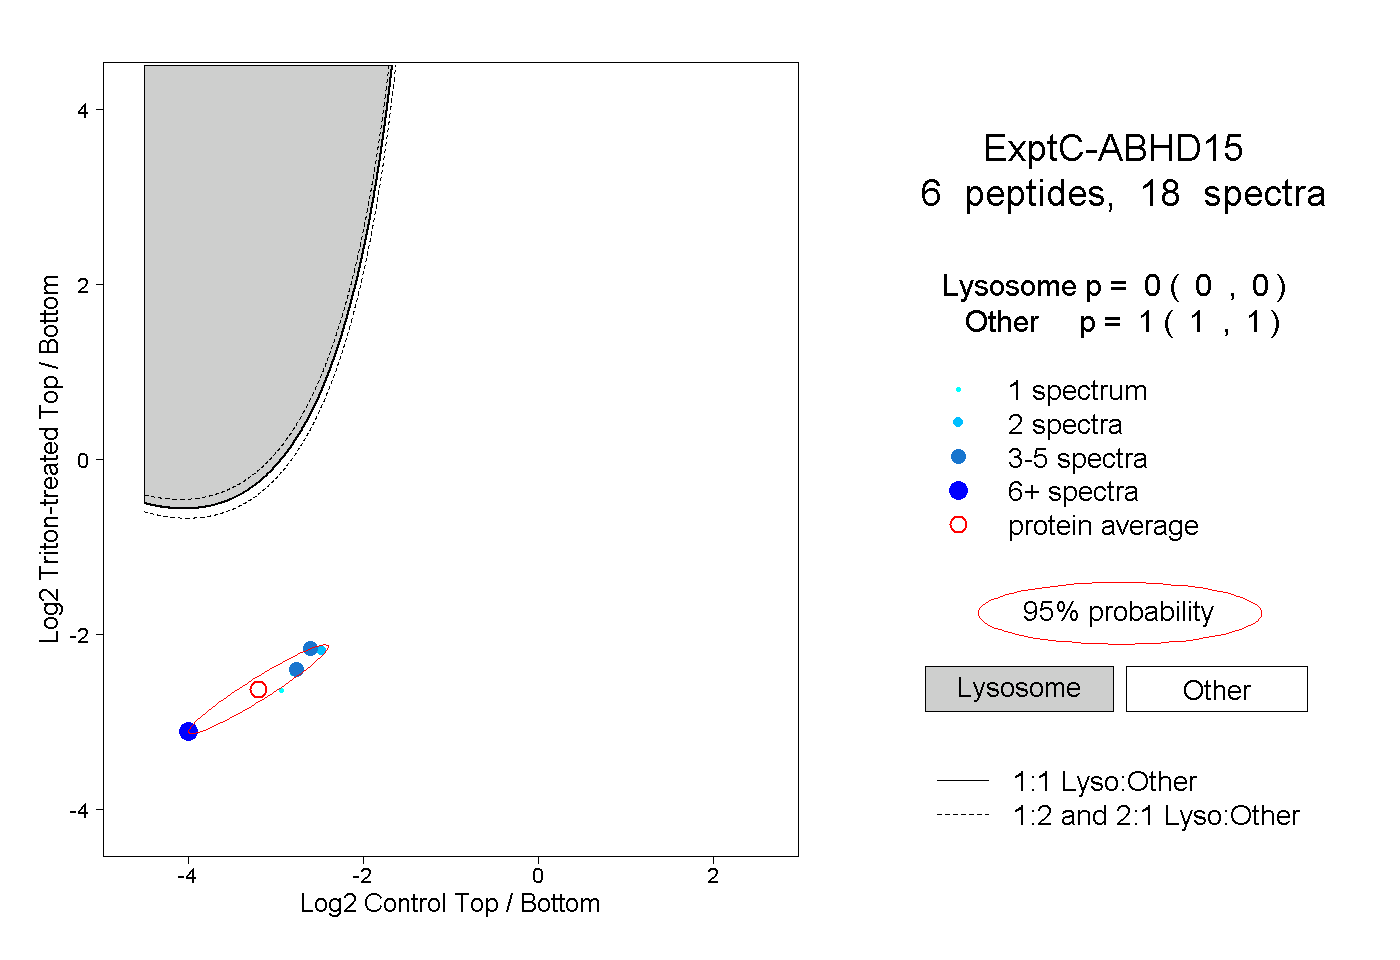
| Expt C |
6
peptides |
18
spectra |
 |
|
0.000
0.000 | 0.000 |
|
|
|
|
|
|
|
1.000
1.000 | 1.000 |