 1
1peptide
spectrum
NA | NA
NA | NA
NA | NA
NA | NA
NA | NA
NA | NA
NA | NA
3peptides
spectra
0.000 | 0.001
0.999 | 1.000
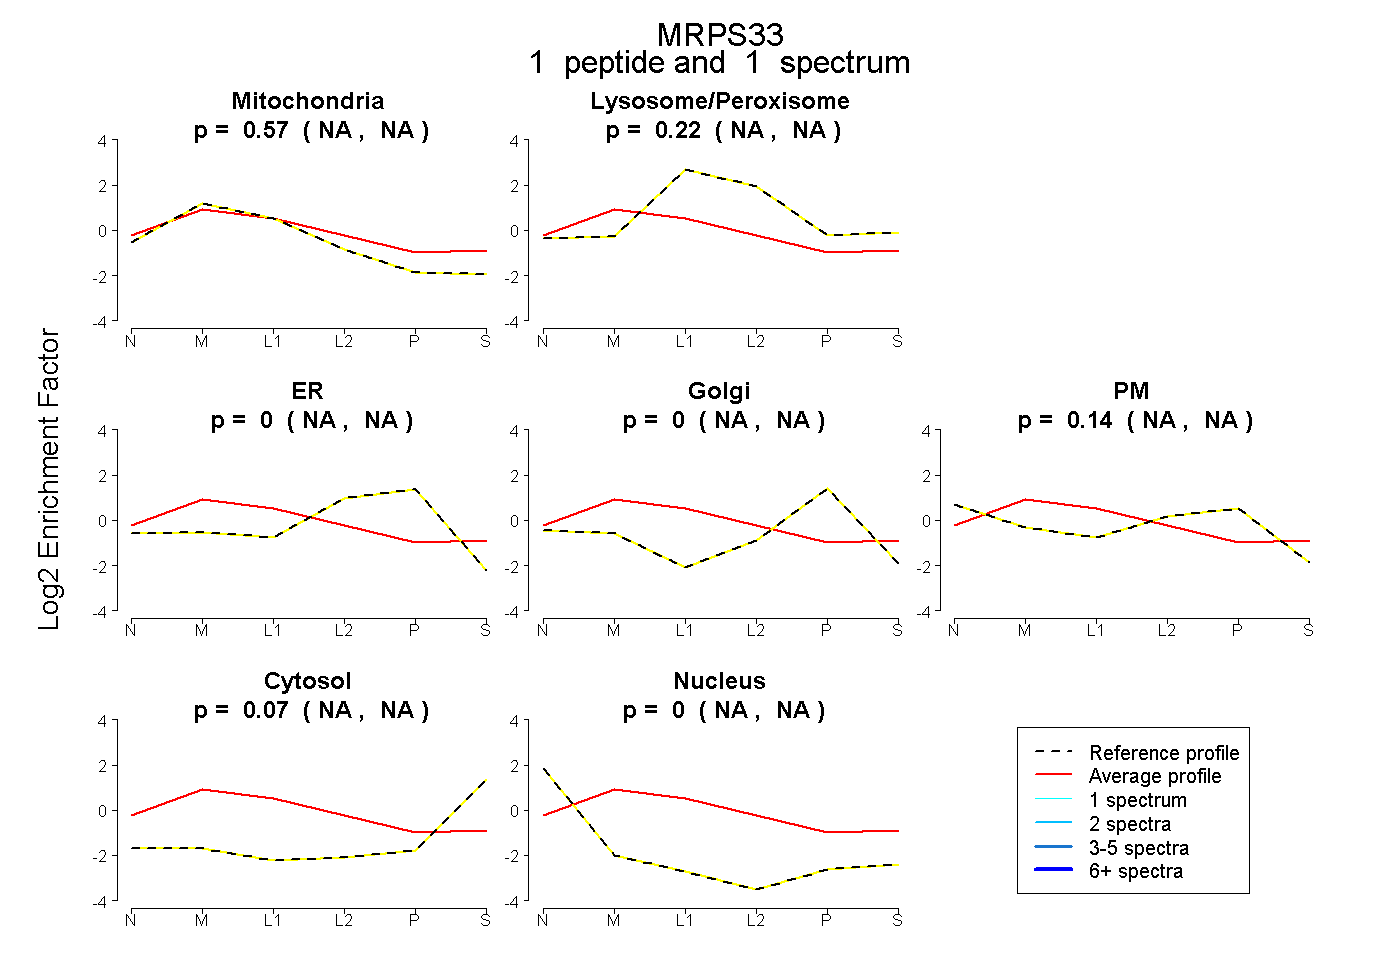
| Plot | Mito | Lyso or Perox | ER | Golgi | PM | Cytosol | Nucleus | ||||||
| Expt B |
1 peptide |
1 spectrum |
|
0.570 NA | NA |
0.215 NA | NA |
0.000 NA | NA |
0.000 NA | NA |
0.142 NA | NA |
0.073 NA | NA |
0.000 NA | NA |
|||
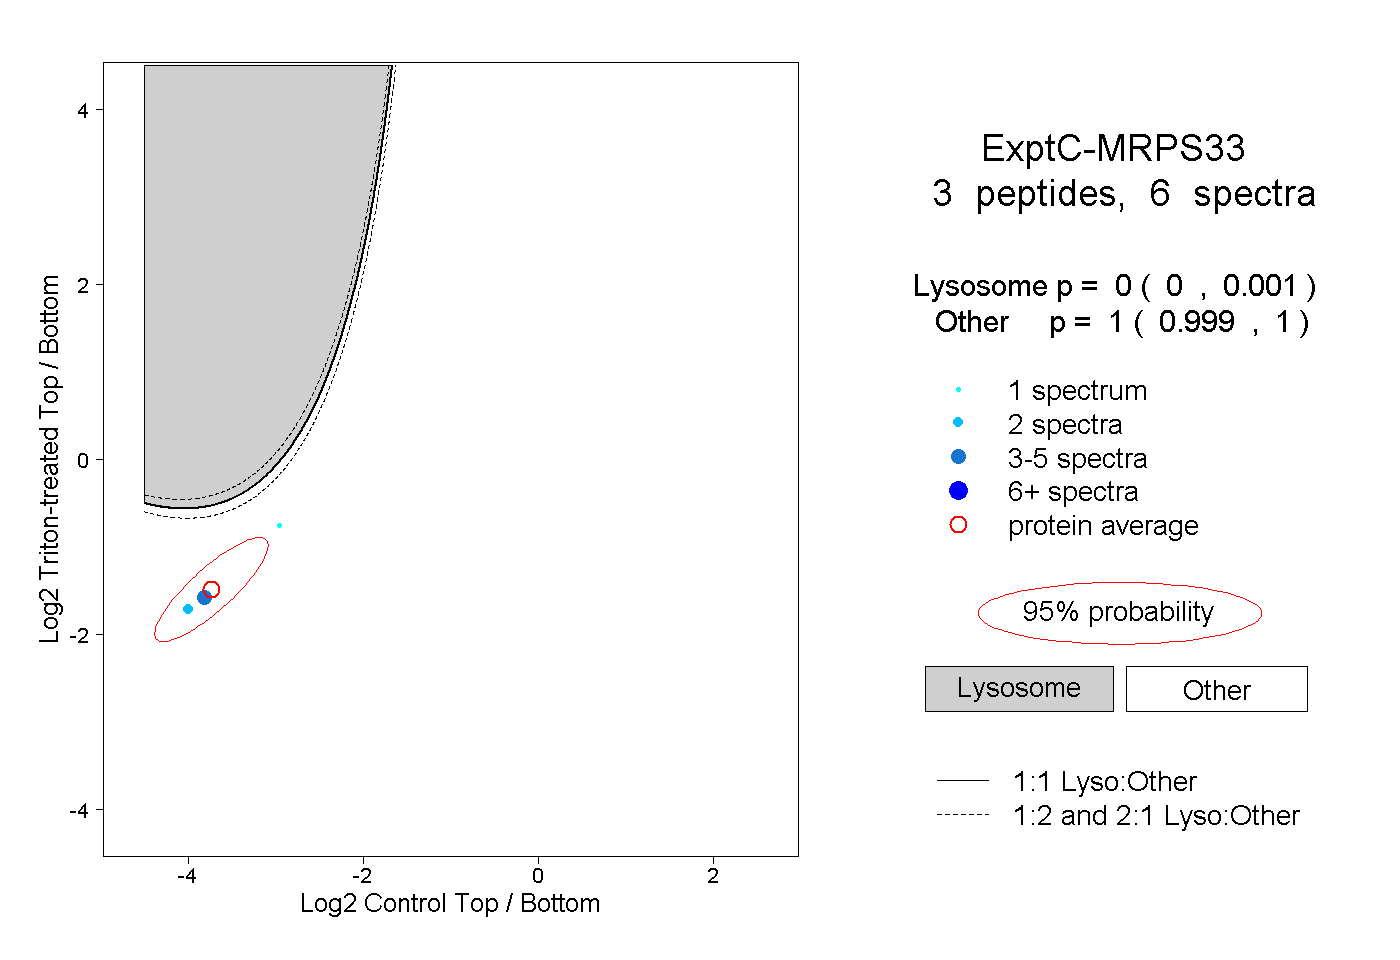
| Plot | Lyso | Other | |||||||||||
| Expt C |
3 peptides |
6 spectra |
|
0.000 0.000 | 0.001 |
1.000 0.999 | 1.000 |