 2
2peptides
spectra
0.000 | 0.054
0.000 | 0.000
0.000 | 0.017
0.000 | 0.234
0.000 | 0.427
0.000 | 0.079
0.000 | 0.193
0.422 | 0.653
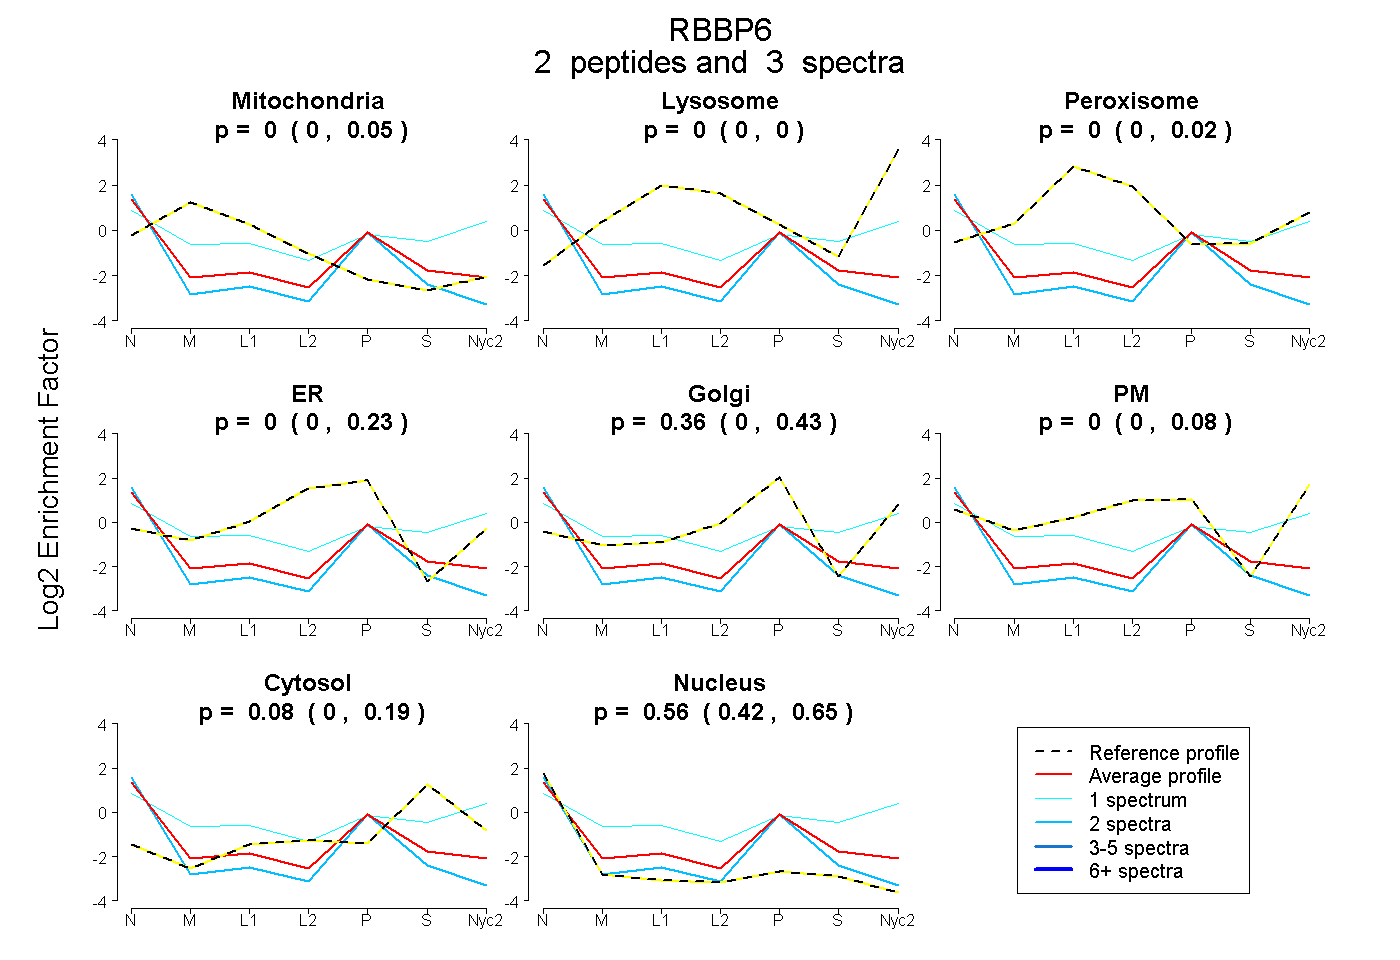
| Plot | Mito | Lyso | Perox | ER | Golgi | PM | Cytosol | Nucleus | |||||
| Expt A |
2 peptides |
3 spectra |
|
0.000 0.000 | 0.054 |
0.000 0.000 | 0.000 |
0.000 0.000 | 0.017 |
0.000 0.000 | 0.234 |
0.359 0.000 | 0.427 |
0.000 0.000 | 0.079 |
0.085 0.000 | 0.193 |
0.556 0.422 | 0.653 |
| 2 spectra, LLPLNIR | 0.000 | 0.000 | 0.000 | 0.000 | 0.242 | 0.000 | 0.000 | 0.758 | ||
| 1 spectrum, EVPPPYDIK | 0.065 | 0.000 | 0.000 | 0.000 | 0.000 | 0.482 | 0.350 | 0.103 |