 5
5peptides
spectra
0.000 | 0.000
0.000 | 0.035
0.000 | 0.041
0.000 | 0.000
0.000 | 0.011
0.664 | 0.752
0.236 | 0.284
0.000 | 0.000
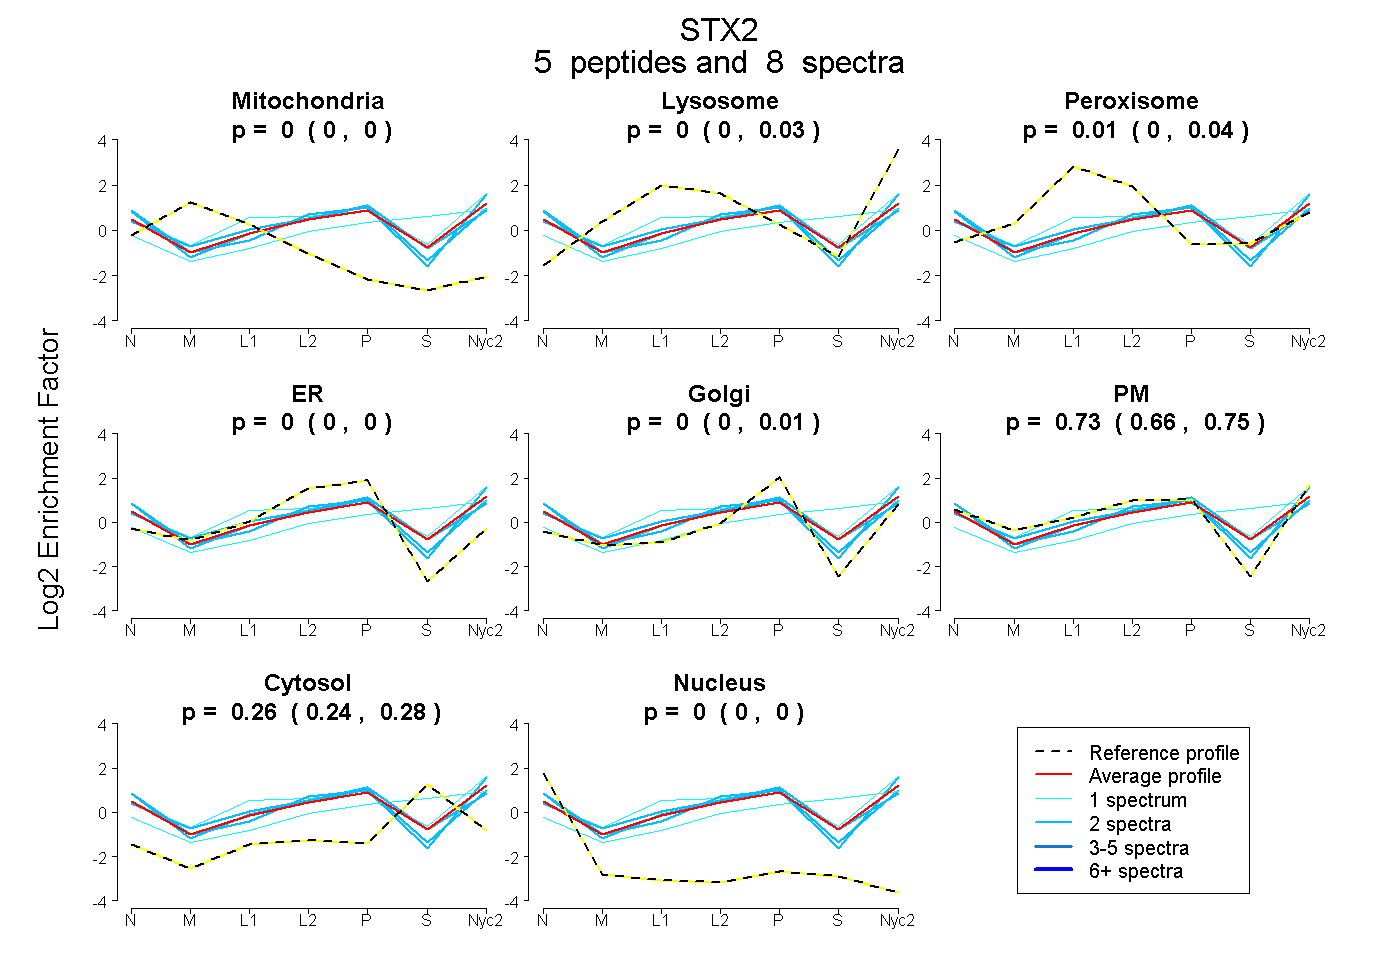
| Plot | Mito | Lyso | Perox | ER | Golgi | PM | Cytosol | Nucleus | |||||
| Expt A |
5 peptides |
8 spectra |
|
0.000 0.000 | 0.000 |
0.000 0.000 | 0.035 |
0.011 0.000 | 0.041 |
0.000 0.000 | 0.000 |
0.000 0.000 | 0.011 |
0.726 0.664 | 0.752 |
0.263 0.236 | 0.284 |
0.000 0.000 | 0.000 |
| 2 spectra, LPDLTACR | 0.000 | 0.000 | 0.000 | 0.040 | 0.019 | 0.740 | 0.184 | 0.017 | ||
| 1 spectrum, DHFMDAFFHQVEEIR | 0.000 | 0.118 | 0.103 | 0.000 | 0.000 | 0.596 | 0.183 | 0.000 | ||
| 2 spectra, TQHSVLSR | 0.000 | 0.000 | 0.122 | 0.007 | 0.164 | 0.511 | 0.196 | 0.000 | ||
| 1 spectrum, SDDGDNAVIITVEK | 0.000 | 0.105 | 0.000 | 0.000 | 0.007 | 0.357 | 0.531 | 0.000 | ||
| 2 spectra, QALNEIESR | 0.000 | 0.000 | 0.000 | 0.000 | 0.033 | 0.833 | 0.132 | 0.002 |
| Plot | Mito | Lyso or Perox | ER | Golgi | PM | Cytosol | Nucleus | ||||||
| Expt B |
1 peptide |
1 spectrum |
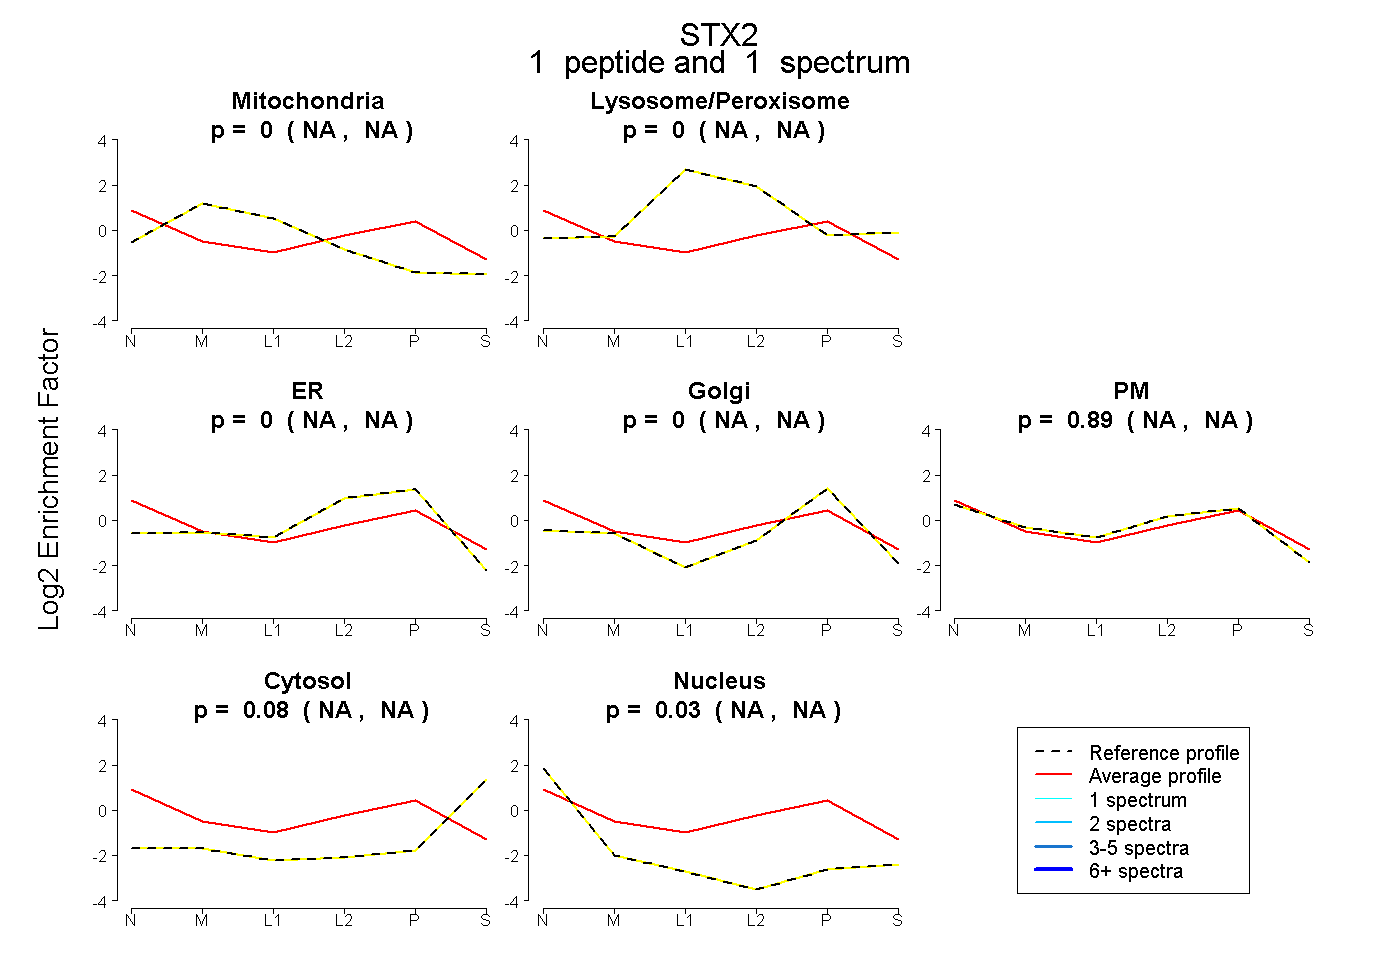 |
0.000 NA | NA |
0.000 NA | NA |
0.000 NA | NA |
0.000 NA | NA |
0.887 NA | NA |
0.084 NA | NA |
0.030 NA | NA |
|||
| Plot | Lyso | Other | |||||||||||
| Expt C |
4 peptides |
12 spectra |
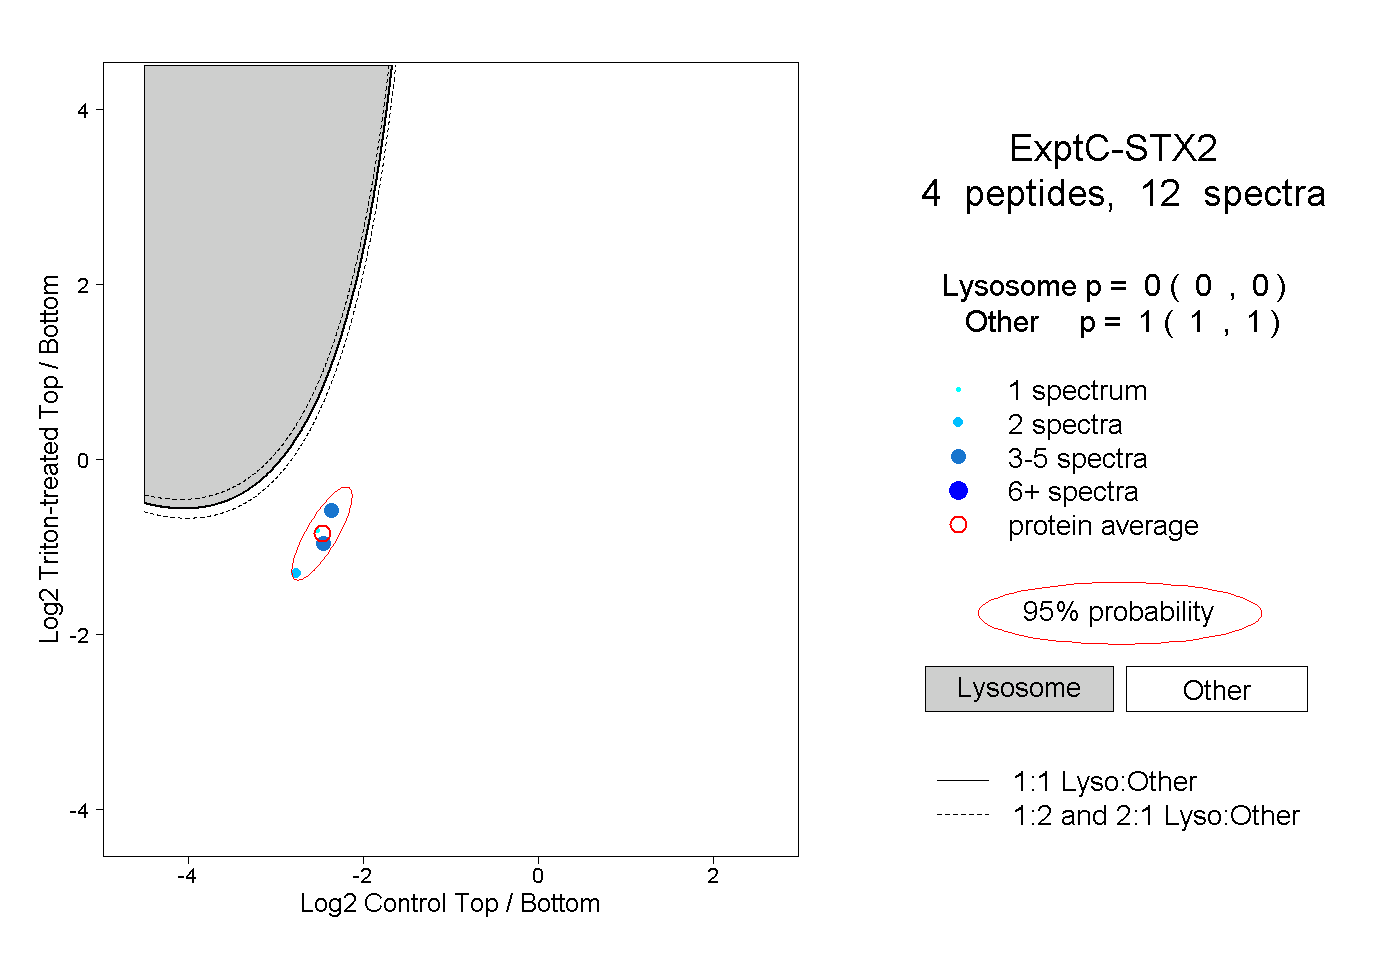 |
0.000 0.000 | 0.000 |
1.000 1.000 | 1.000 |
||||||||
| Plot | Lyso | Other | |||||||||||
| Expt D |
1 peptide |
2 spectra |
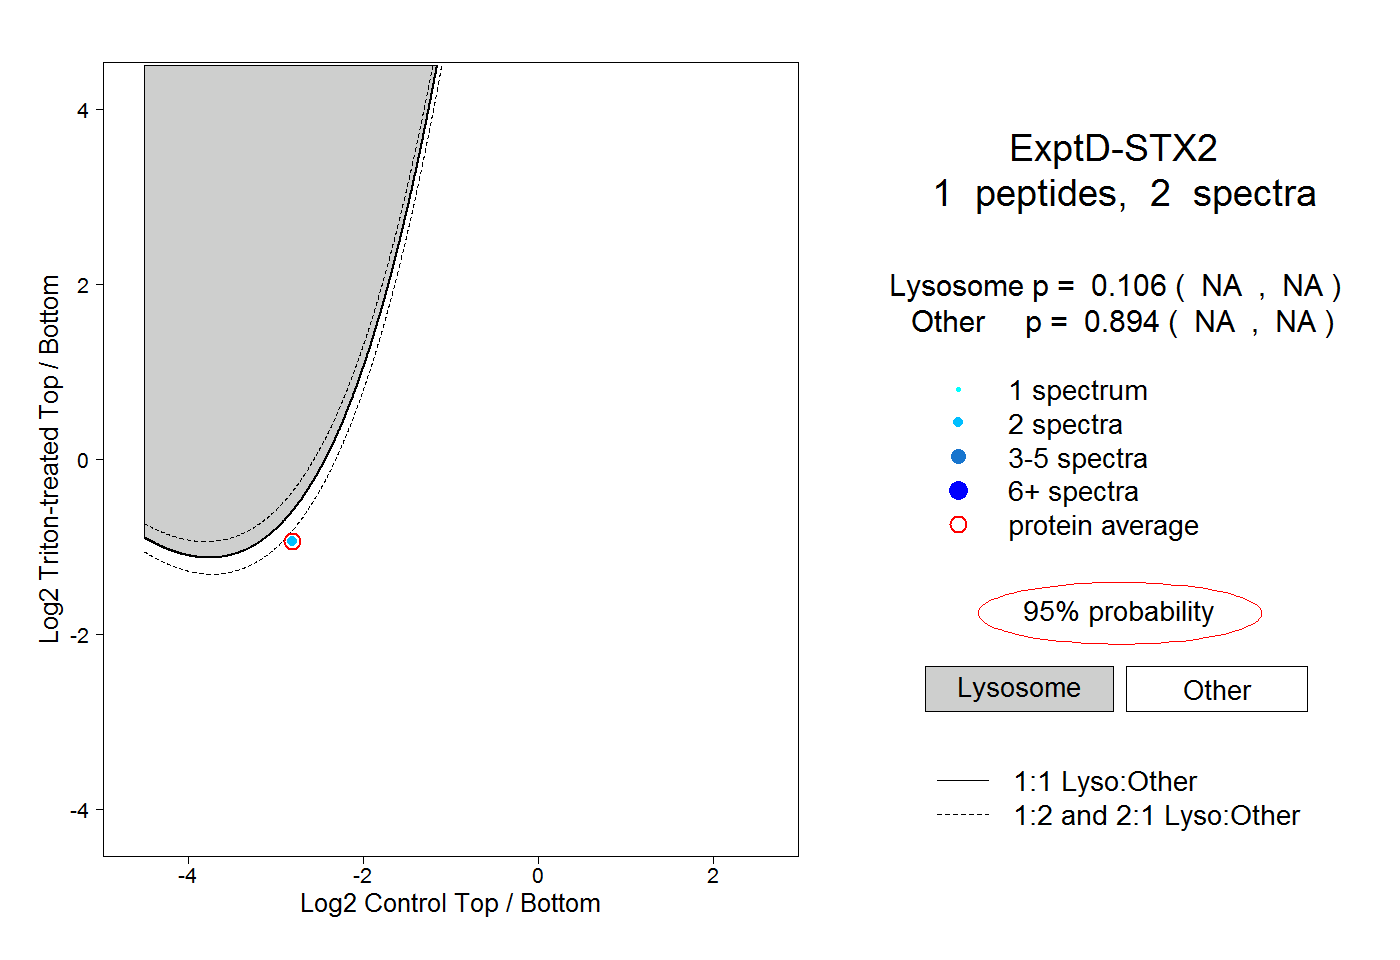 |
0.106 NA | NA |
0.894 NA | NA |