 5
5peptides
spectra
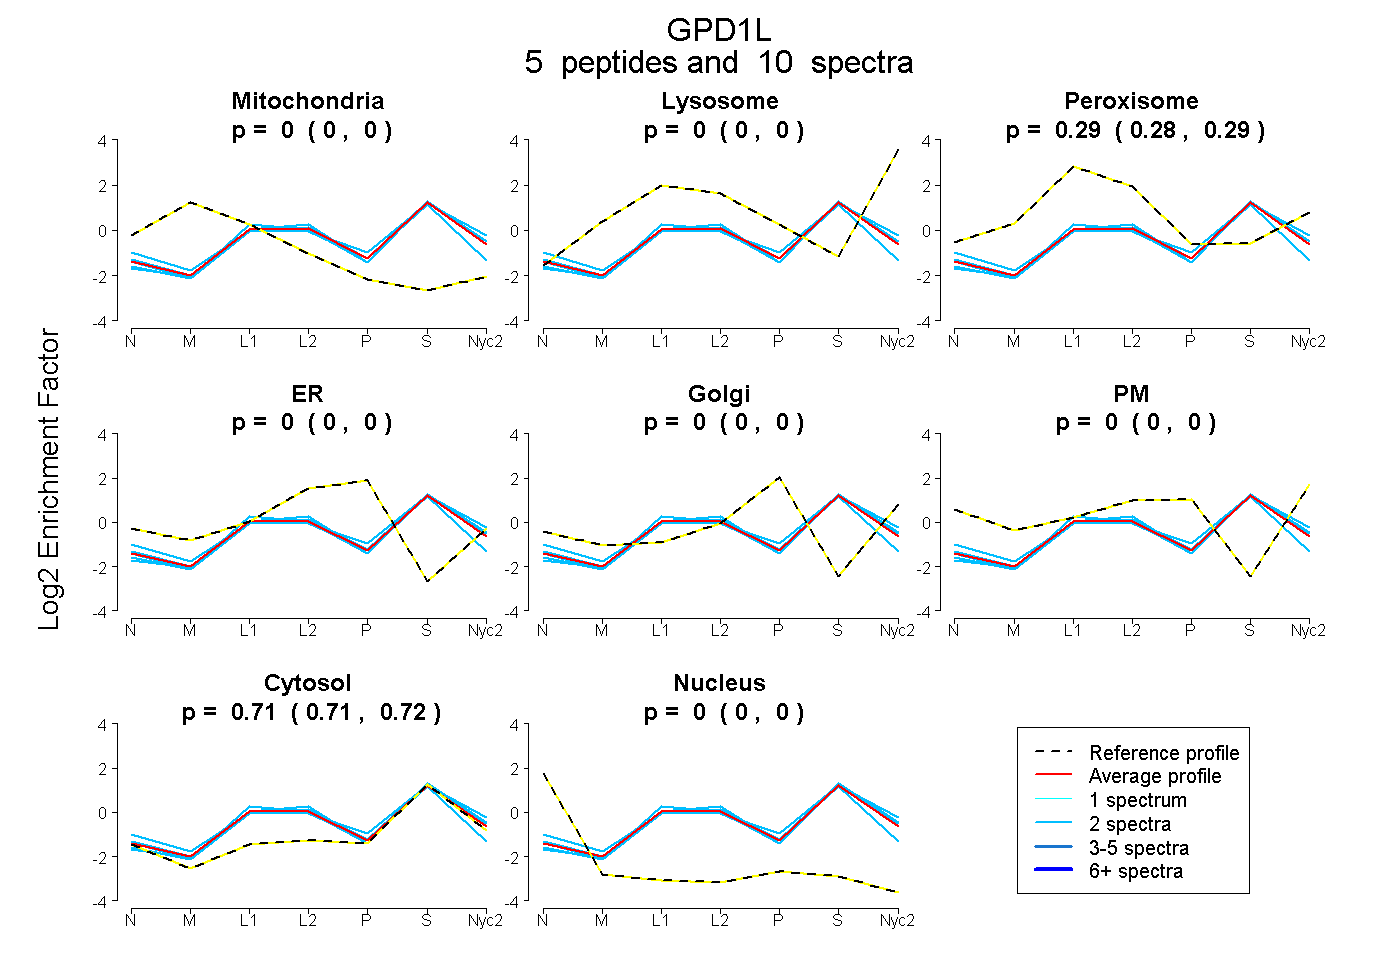
0.000 | 0.000
0.000 | 0.000
0.281 | 0.294
0.000 | 0.000
0.000 | 0.000
0.000 | 0.000
0.705 | 0.718
0.000 | 0.000
3peptides
spectra
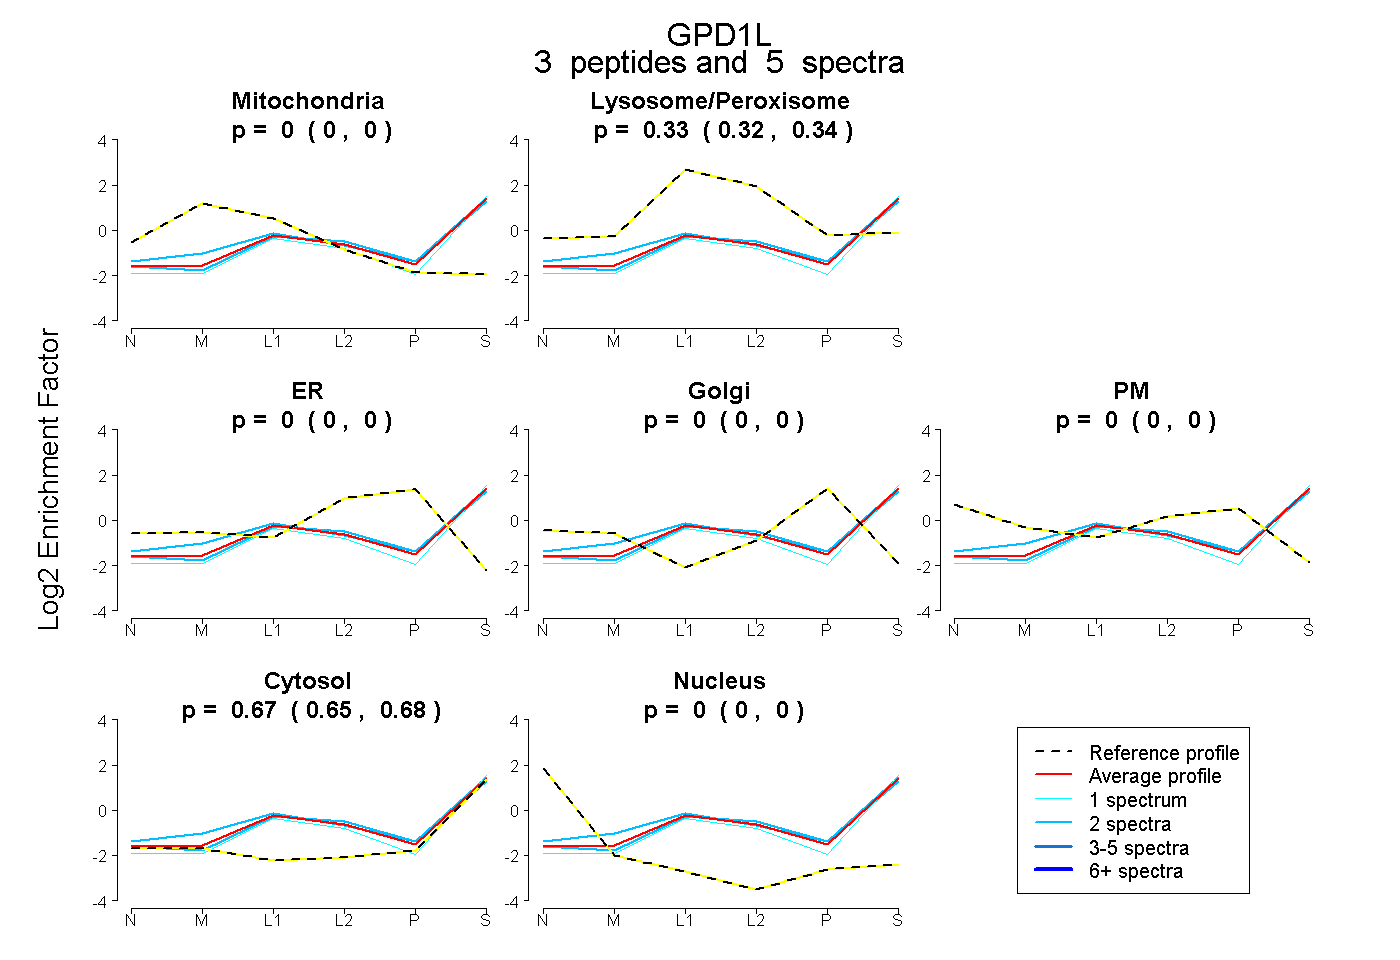
0.000 | 0.000
0.319 | 0.344
0.000 | 0.000
0.000 | 0.000
0.000 | 0.000
0.654 | 0.678
0.000 | 0.000
14peptides
spectra
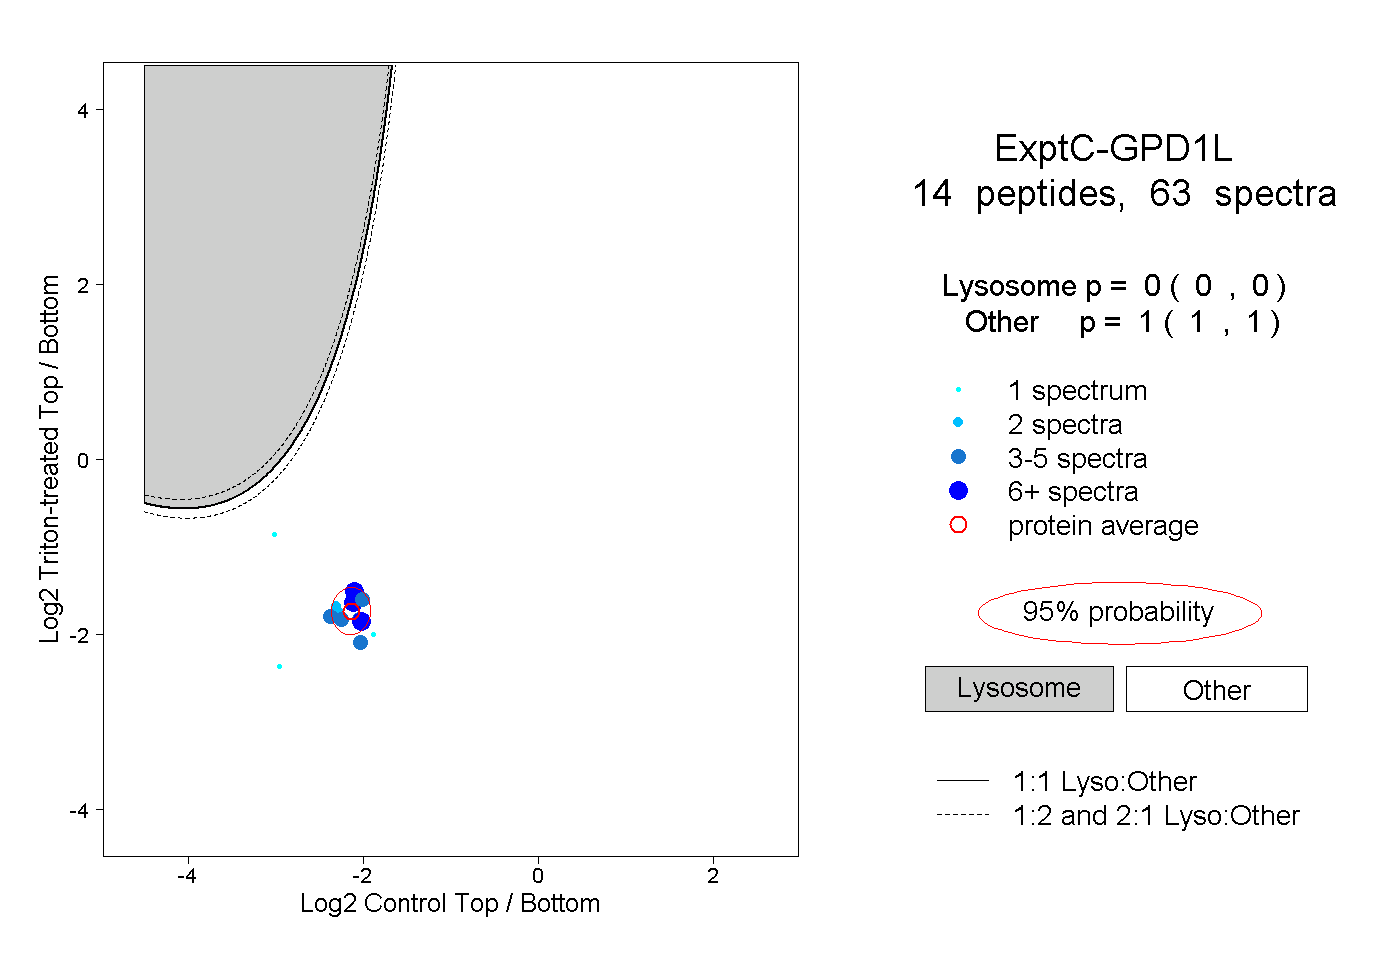
0.000 | 0.000
1.000 | 1.000
6peptides
spectra
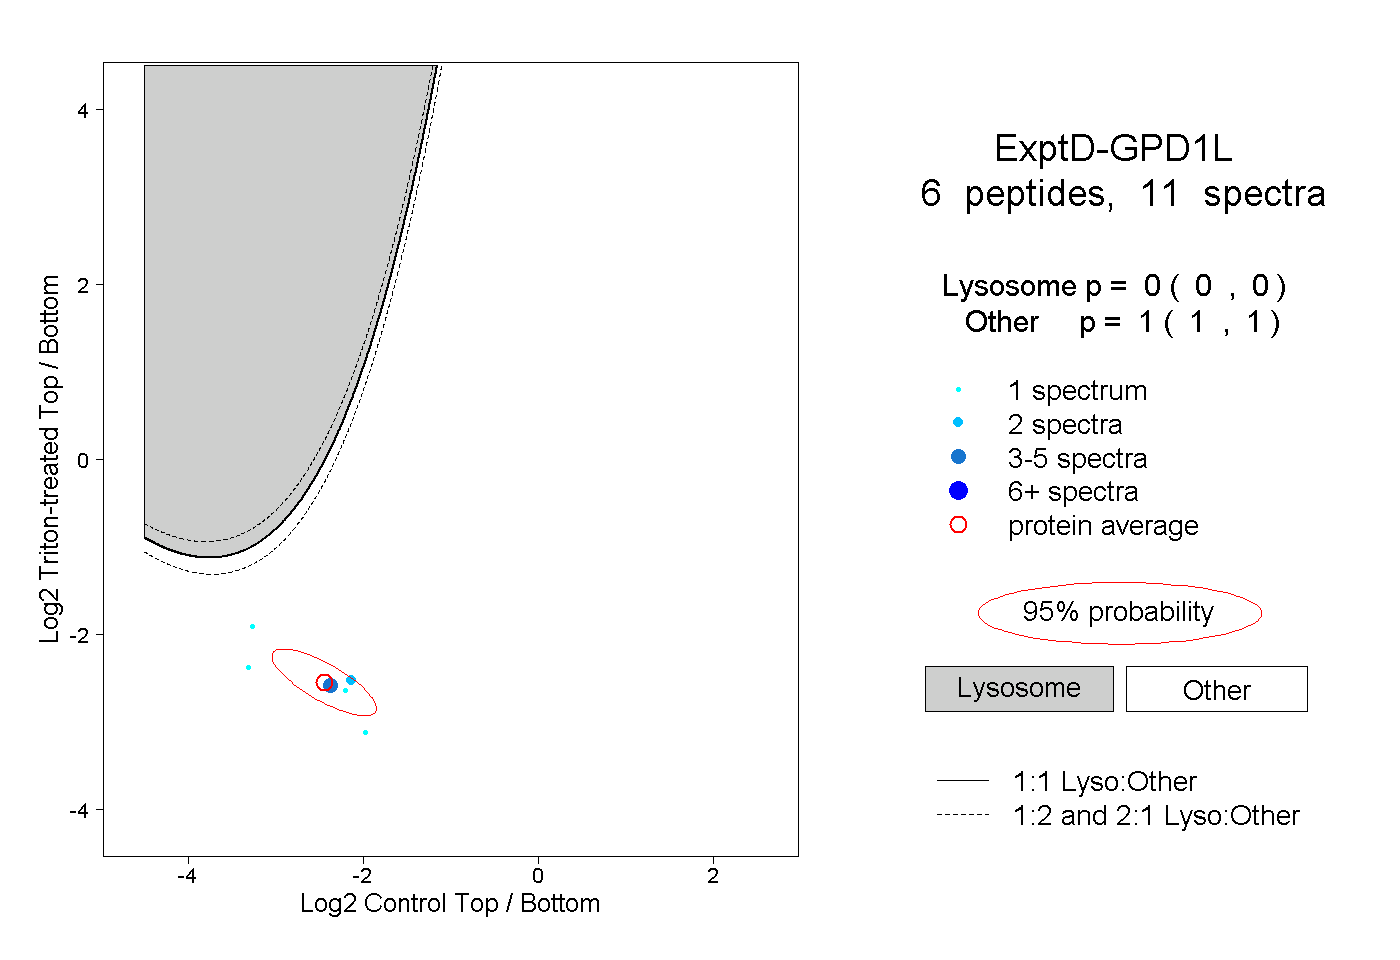
0.000 | 0.000
1.000 | 1.000