 2
2peptides
spectra
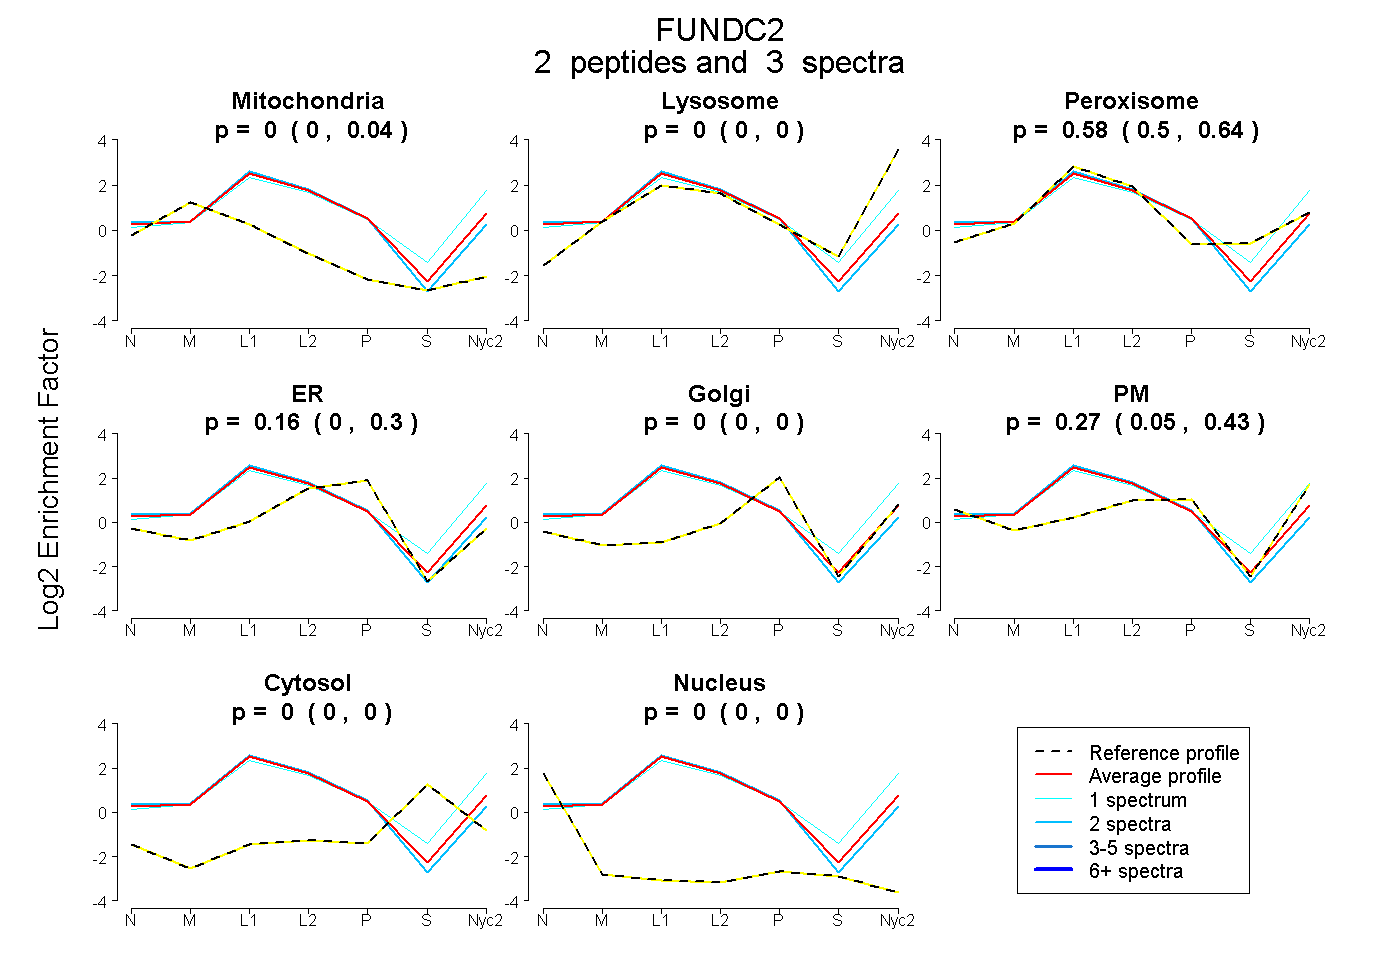
0.000 | 0.039
0.000 | 0.000
0.498 | 0.638
0.000 | 0.300
0.000 | 0.000
0.051 | 0.430
0.000 | 0.000
0.000 | 0.000
1peptide
spectra
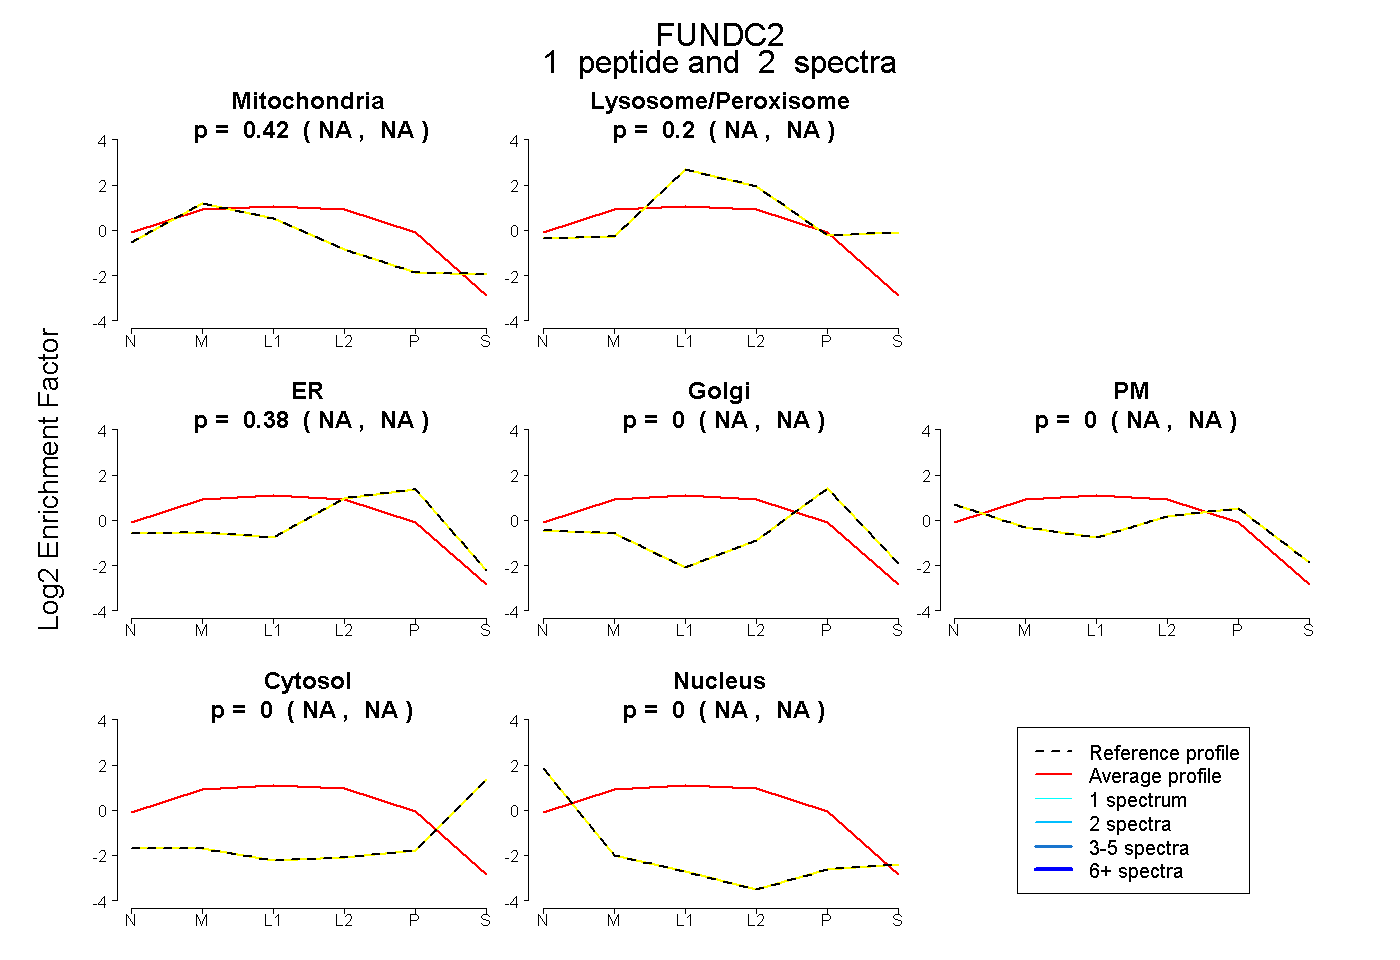
NA | NA
NA | NA
NA | NA
NA | NA
NA | NA
NA | NA
NA | NA
3peptides
spectra
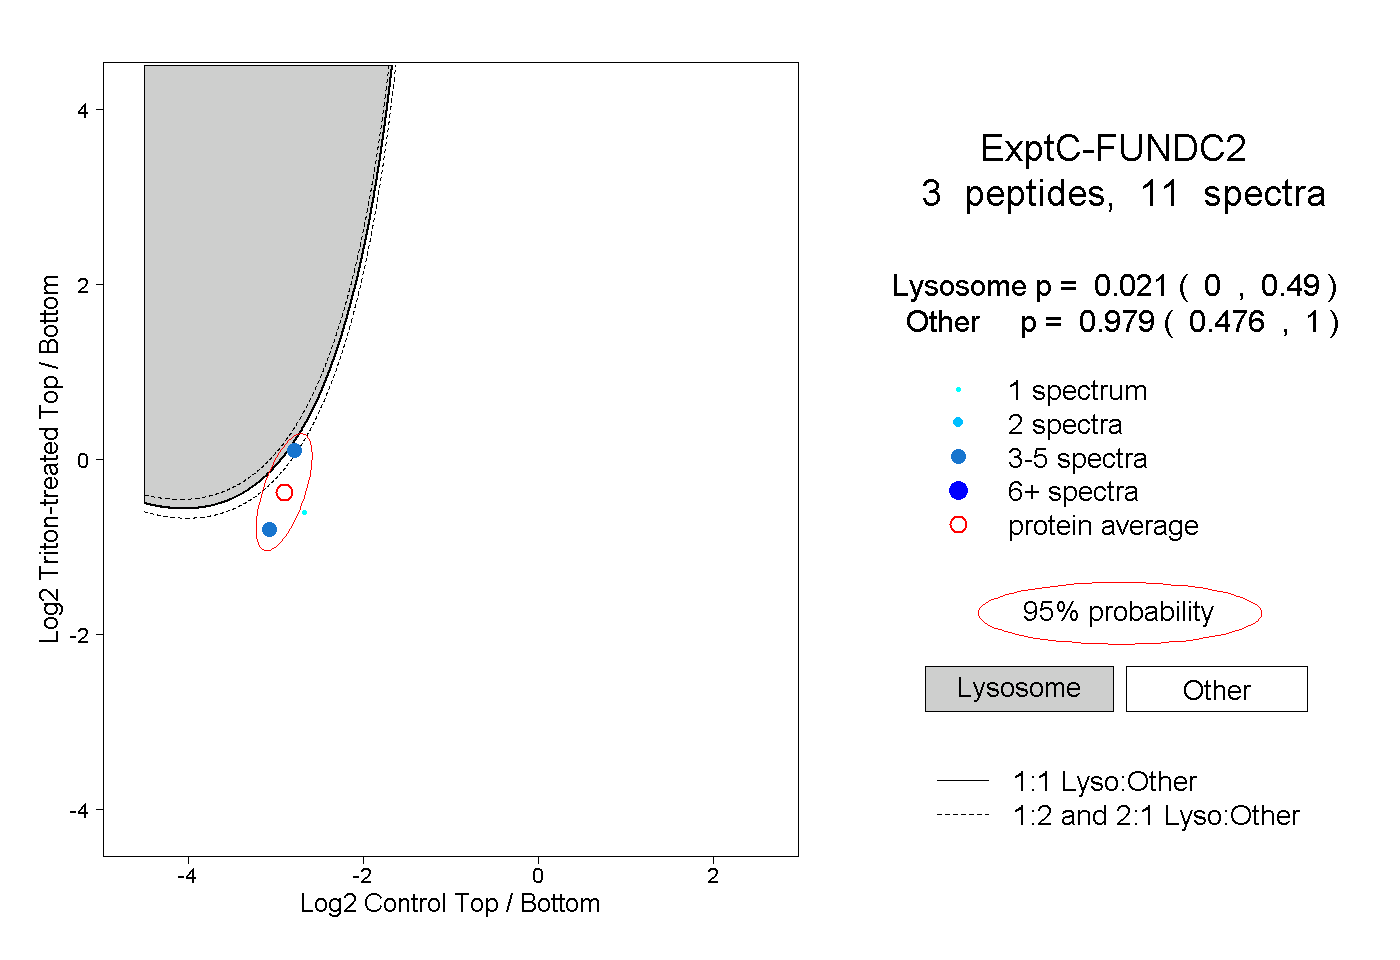
0.000 | 0.490
0.476 | 1.000
1peptide
spectra
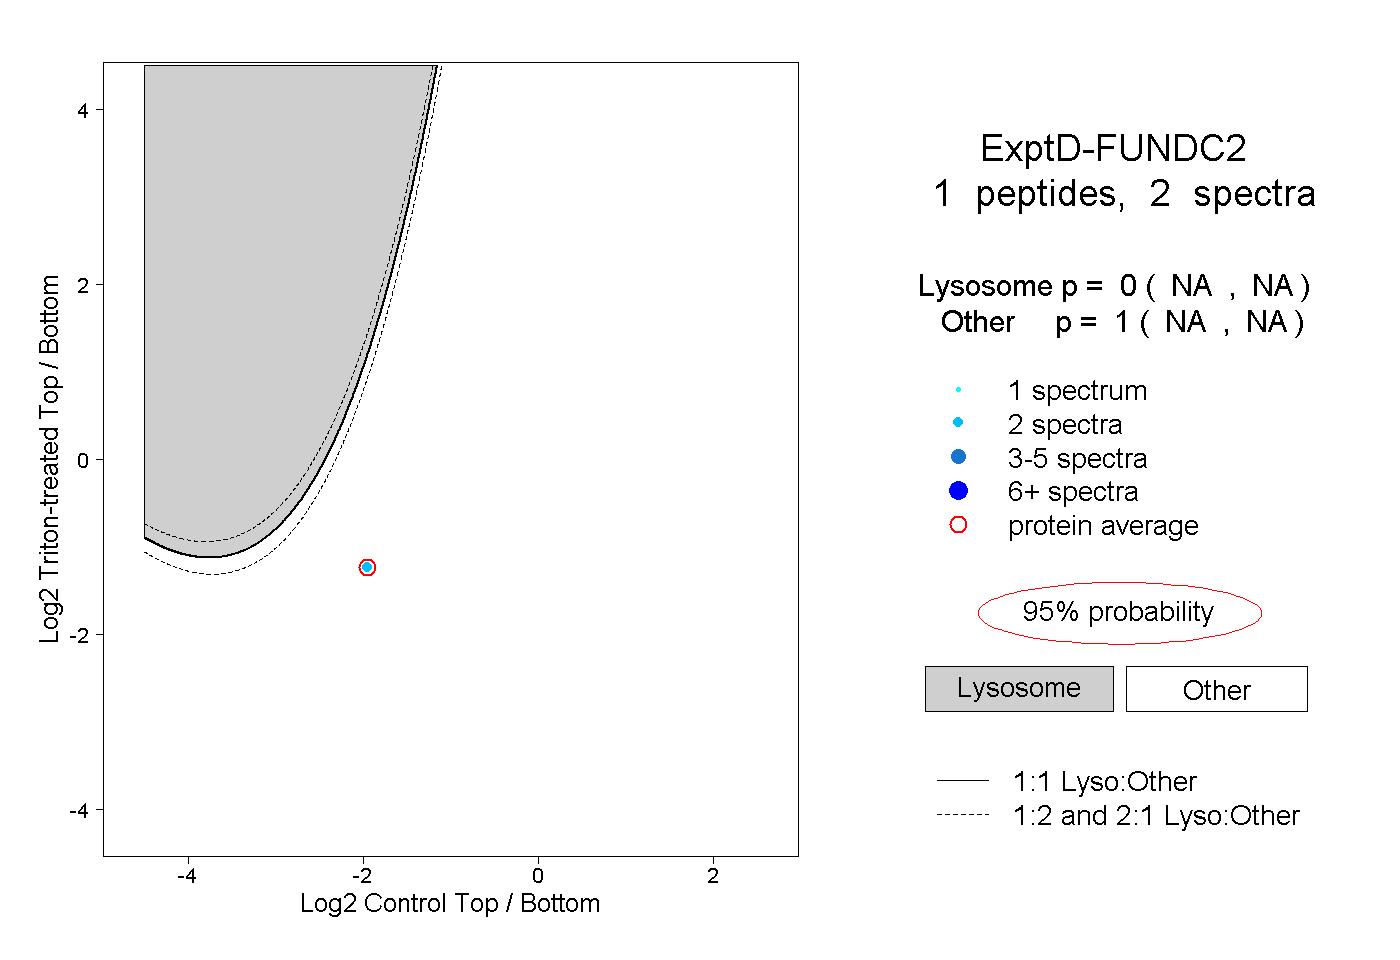
NA | NA
NA | NA