 4
4peptides
spectra
0.000 | 0.000
0.000 | 0.000
0.000 | 0.000
0.000 | 0.000
0.009 | 0.083
0.734 | 0.820
0.000 | 0.000
0.156 | 0.181
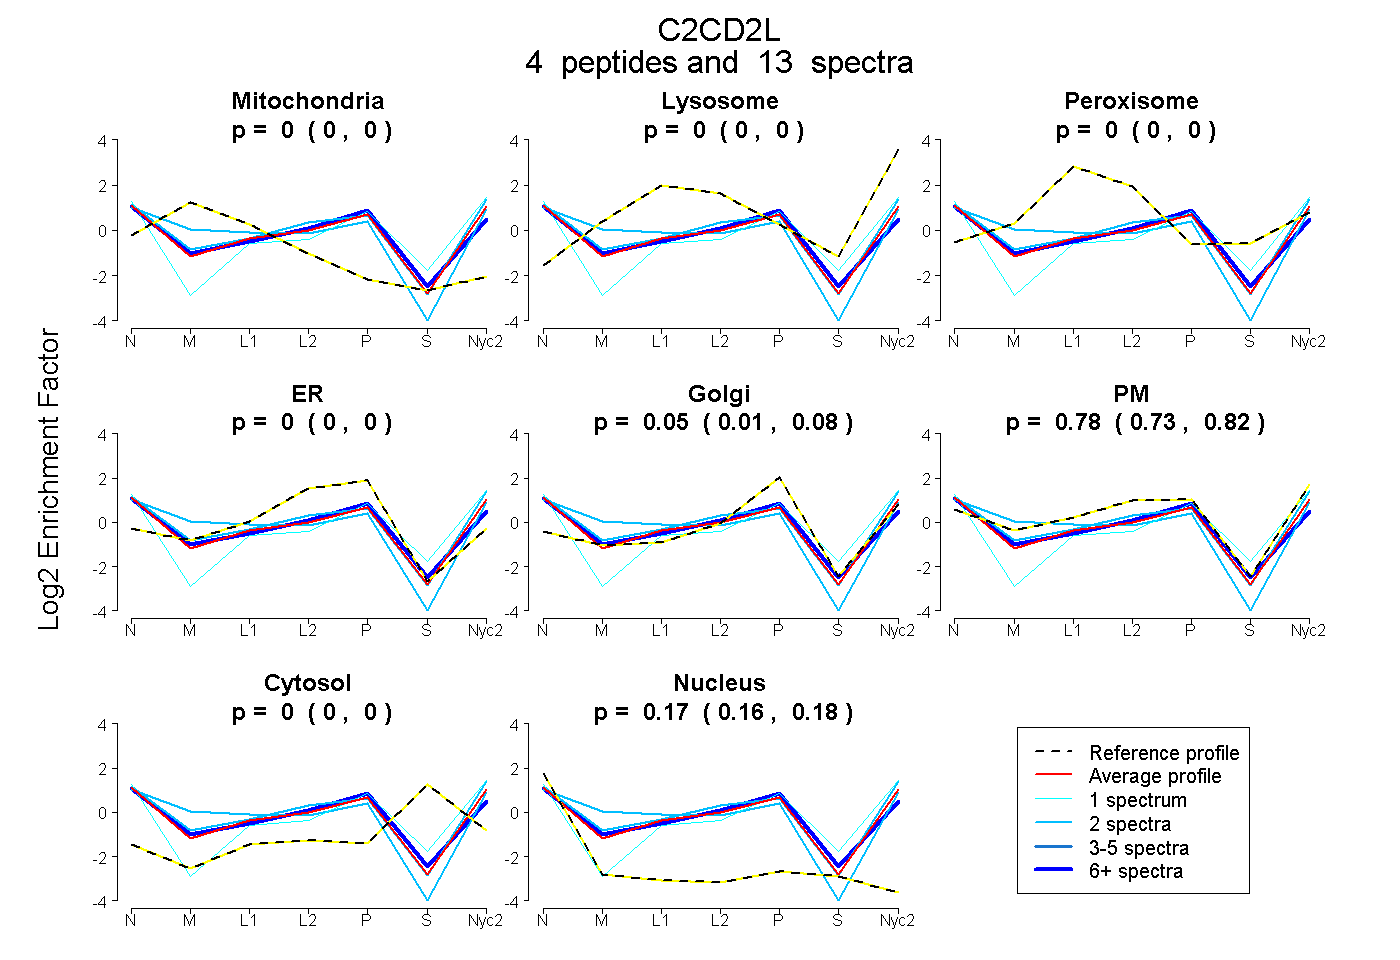
| Plot | Mito | Lyso | Perox | ER | Golgi | PM | Cytosol | Nucleus | |||||
| Expt A |
4 peptides |
13 spectra |
|
0.000 0.000 | 0.000 |
0.000 0.000 | 0.000 |
0.000 0.000 | 0.000 |
0.000 0.000 | 0.000 |
0.050 0.009 | 0.083 |
0.780 0.734 | 0.820 |
0.000 0.000 | 0.000 |
0.170 0.156 | 0.181 |
| 8 spectra, ALNEQACR | 0.000 | 0.000 | 0.000 | 0.043 | 0.129 | 0.649 | 0.000 | 0.179 | ||
| 2 spectra, SSAPEEAGVR | 0.000 | 0.000 | 0.000 | 0.000 | 0.000 | 0.874 | 0.000 | 0.126 | ||
| 1 spectrum, STLIISGVSK | 0.000 | 0.000 | 0.000 | 0.000 | 0.198 | 0.540 | 0.131 | 0.130 | ||
| 2 spectra, GLWLSR | 0.146 | 0.000 | 0.000 | 0.000 | 0.000 | 0.759 | 0.000 | 0.096 |
| Plot | Mito | Lyso or Perox | ER | Golgi | PM | Cytosol | Nucleus | ||||||
| Expt B |
1 peptide |
1 spectrum |
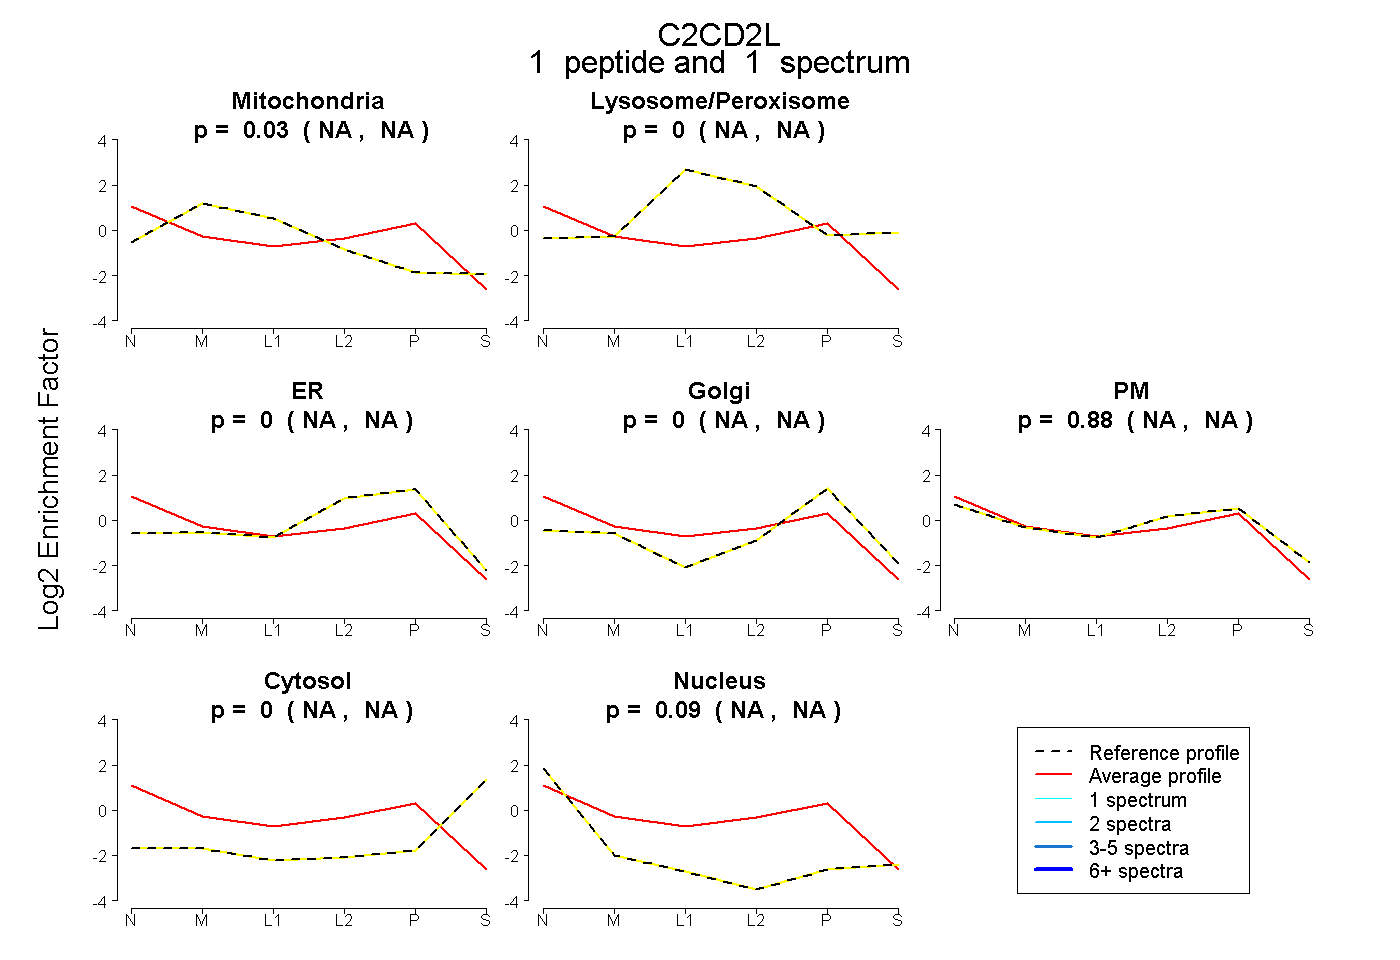 |
0.026 NA | NA |
0.000 NA | NA |
0.000 NA | NA |
0.000 NA | NA |
0.880 NA | NA |
0.000 NA | NA |
0.094 NA | NA |
|||
| Plot | Lyso | Other | |||||||||||
| Expt C |
3 peptides |
24 spectra |
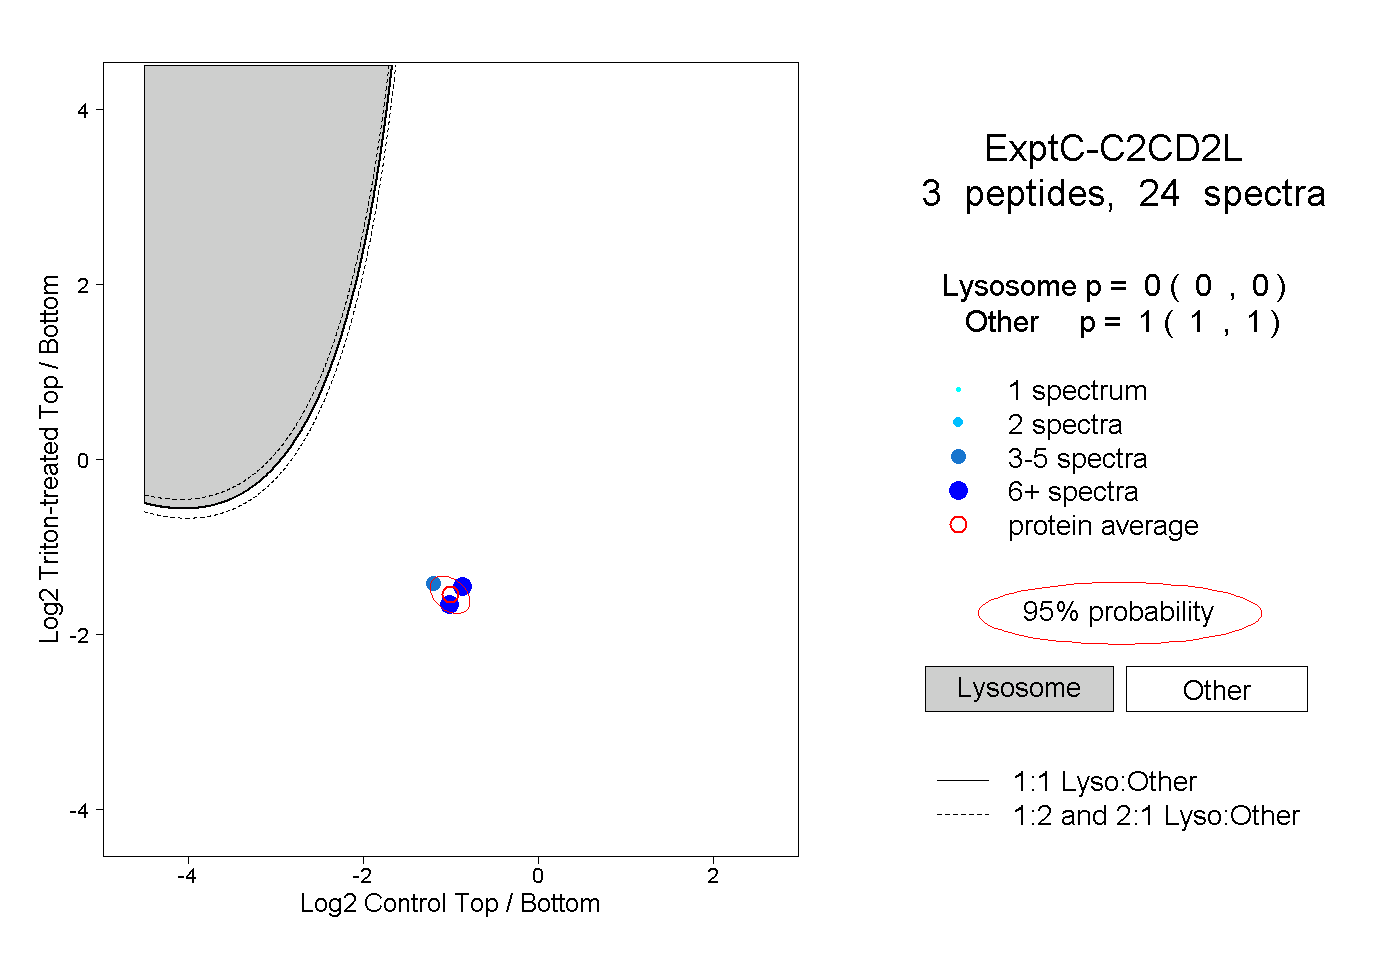 |
0.000 0.000 | 0.000 |
1.000 1.000 | 1.000 |
||||||||
| Plot | Lyso | Other | |||||||||||
| Expt D |
1 peptide |
1 spectrum |
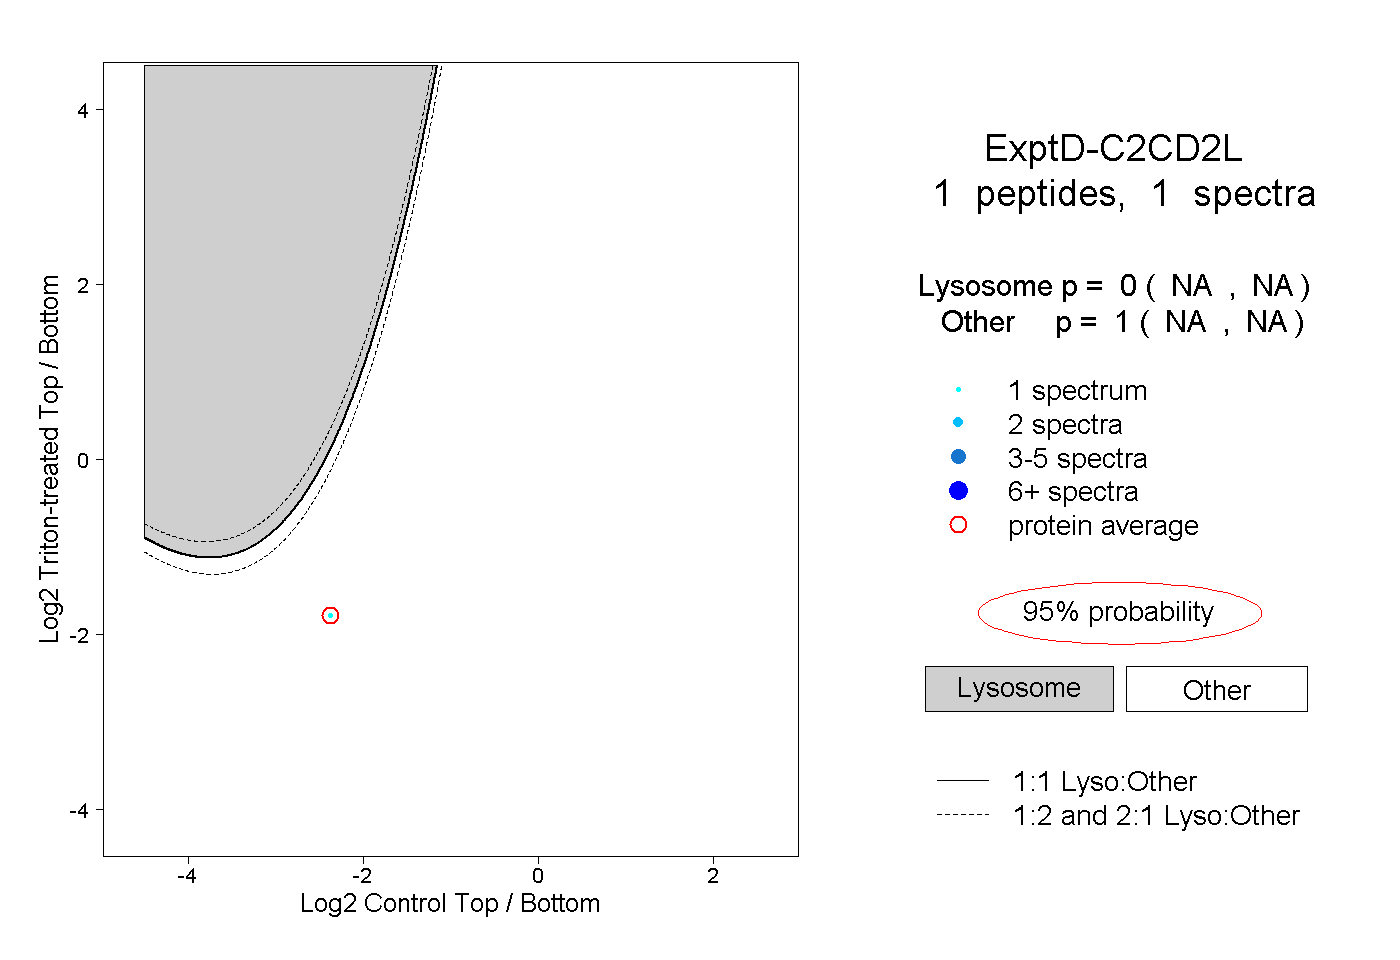 |
0.000 NA | NA |
1.000 NA | NA |