 2
2peptides
spectra
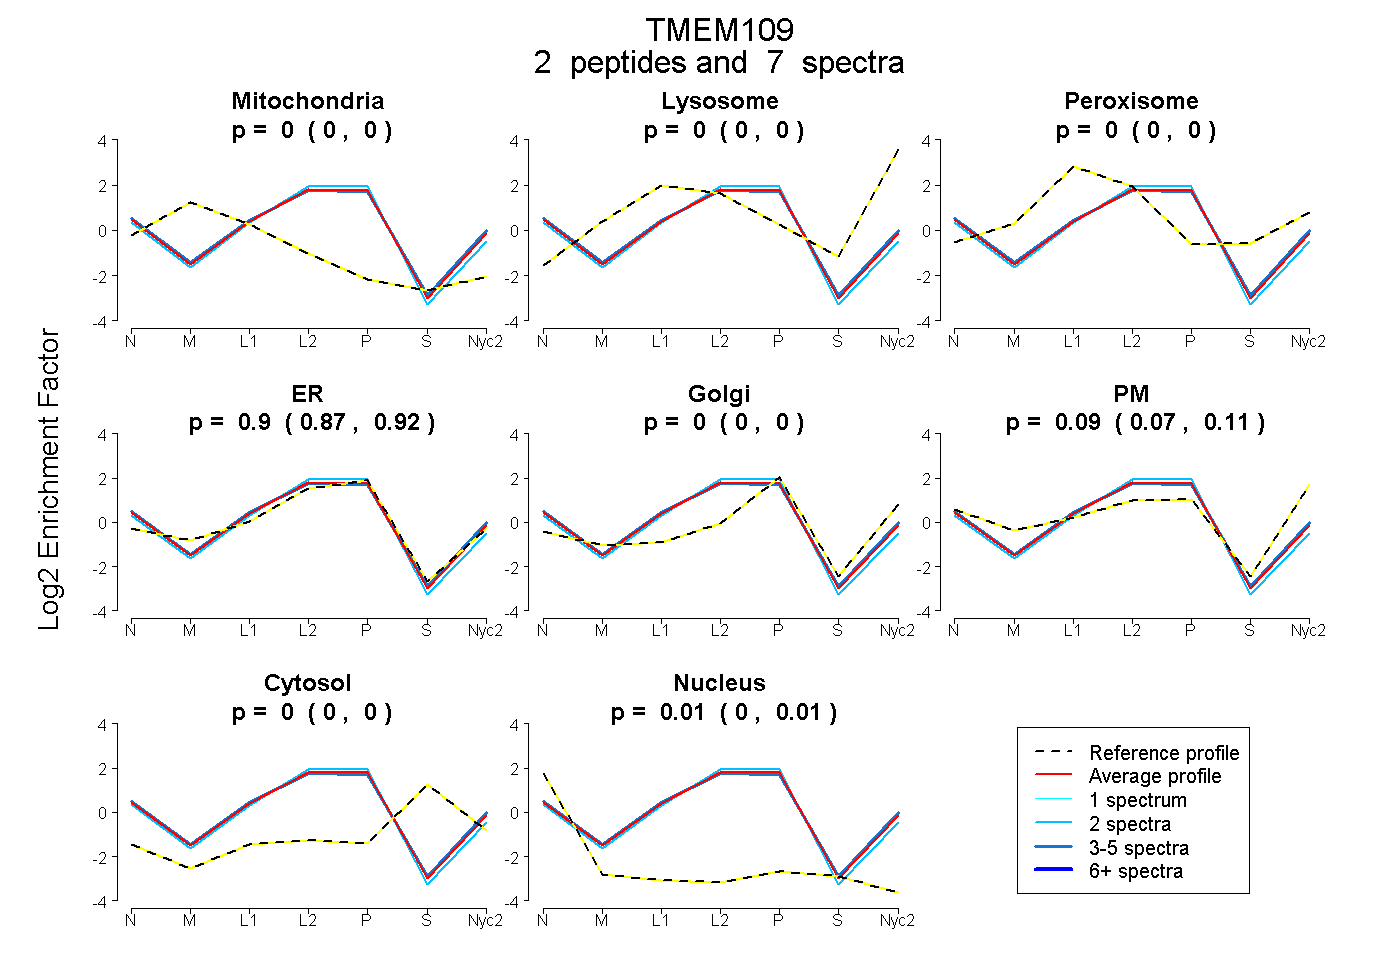
0.000 | 0.000
0.000 | 0.000
0.000 | 0.000
0.873 | 0.919
0.000 | 0.000
0.065 | 0.114
0.000 | 0.000
0.004 | 0.014
1peptide
spectra
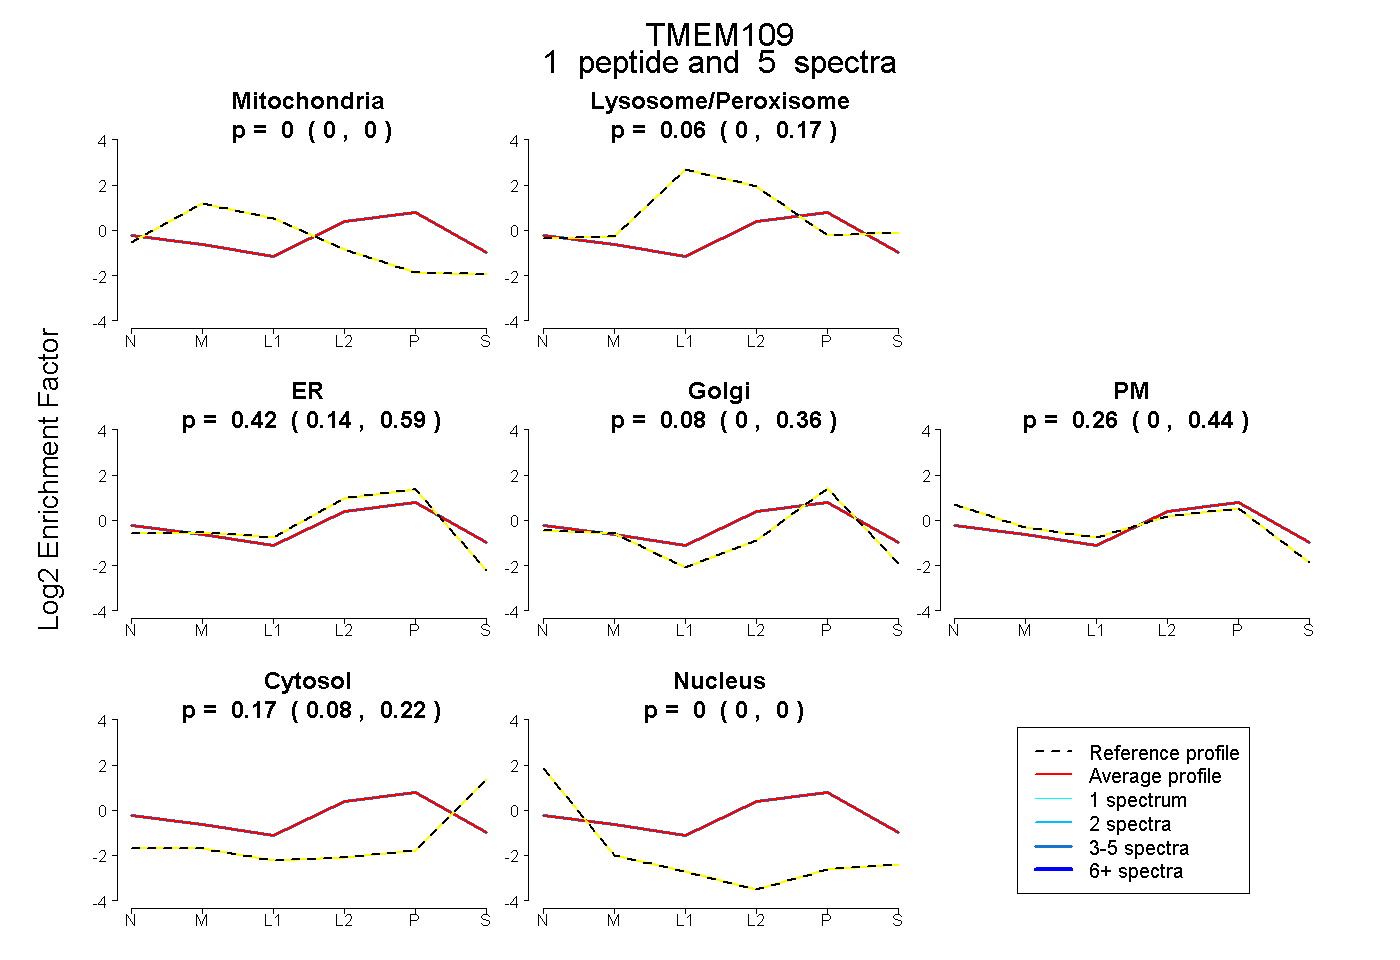
0.000 | 0.000
0.000 | 0.167
0.142 | 0.592
0.000 | 0.359
0.000 | 0.438
0.079 | 0.223
0.000 | 0.000
4peptides
spectra
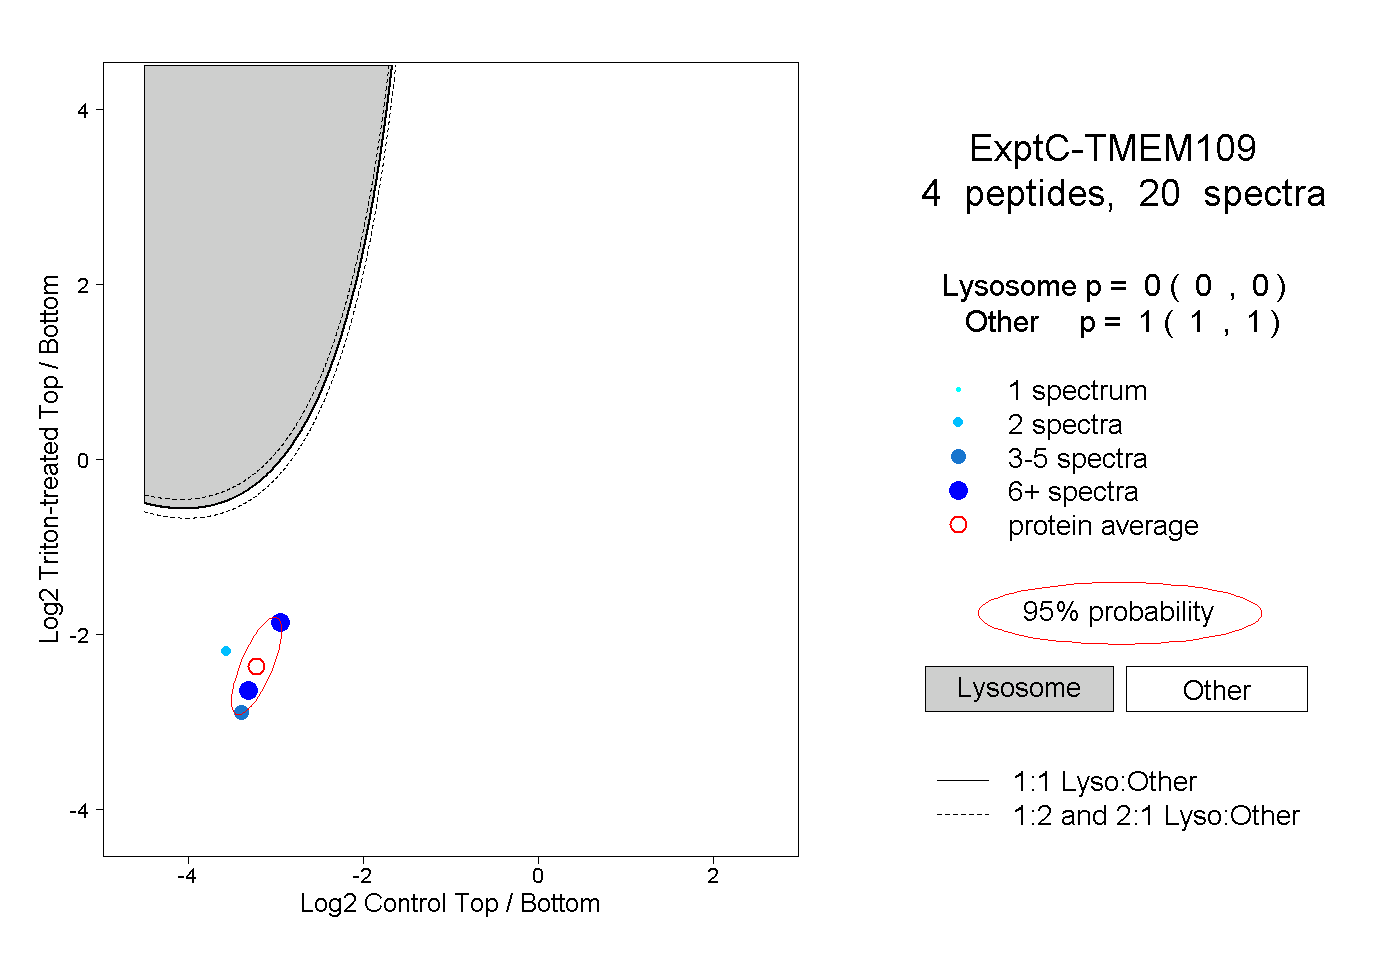
0.000 | 0.000
1.000 | 1.000
1peptide
spectrum
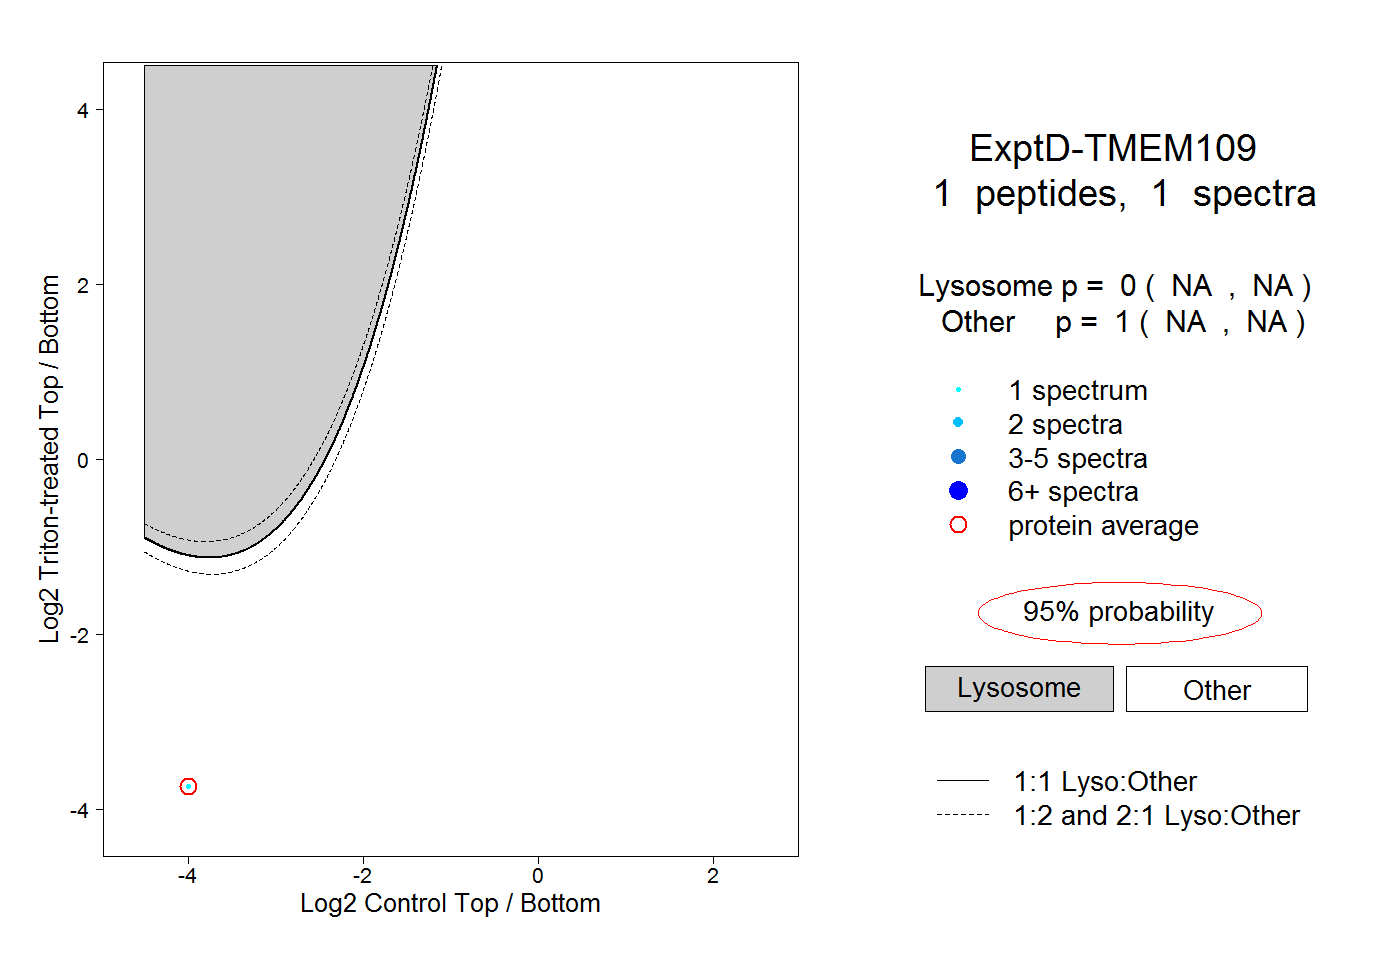
NA | NA
NA | NA