 2
2peptides
spectra
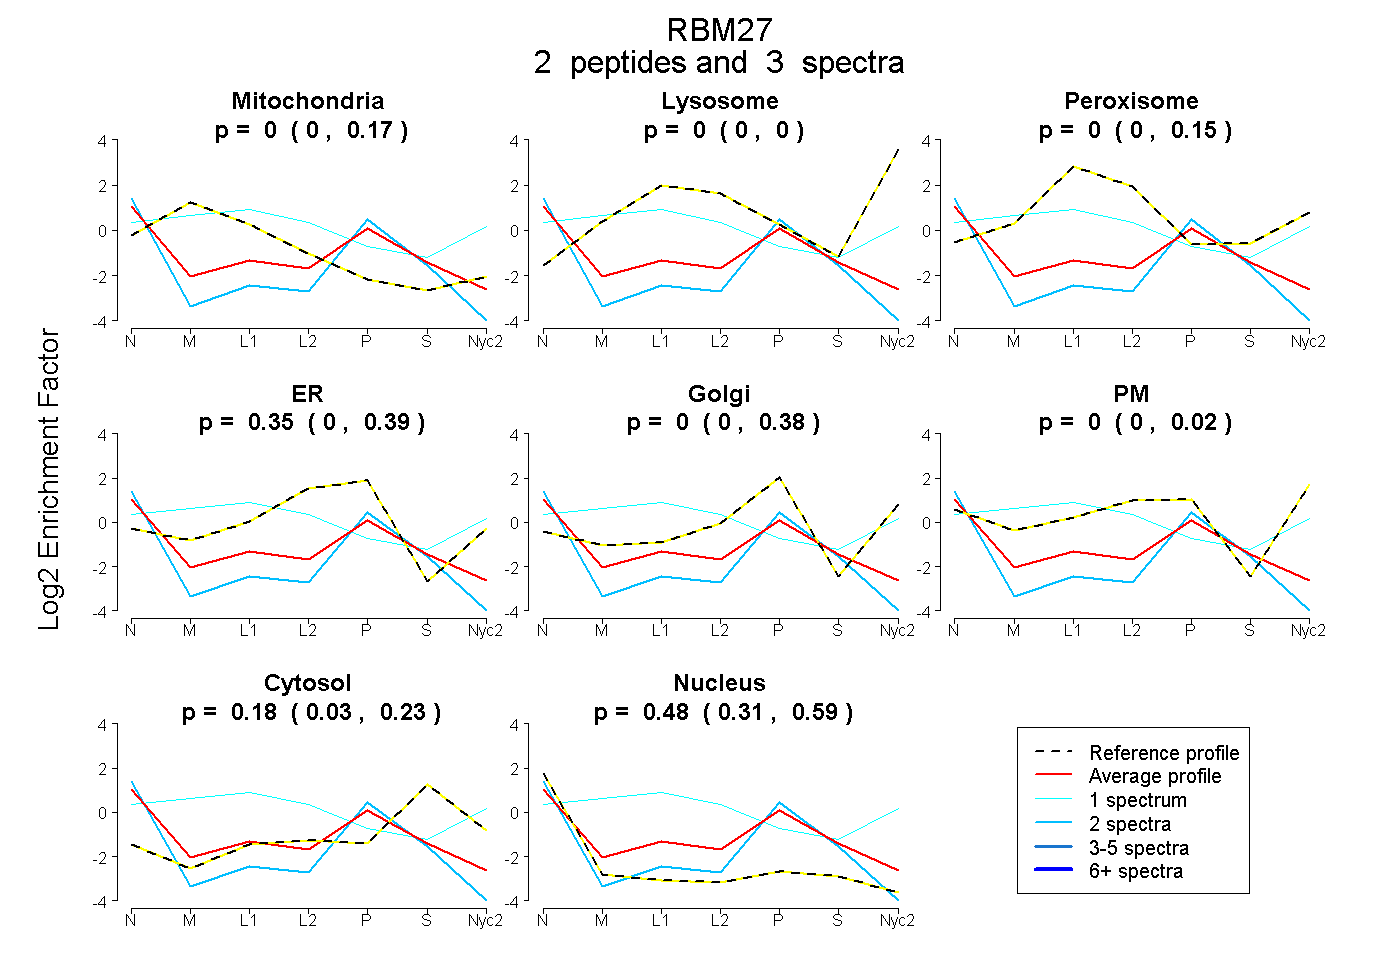
0.000 | 0.169
0.000 | 0.000
0.000 | 0.146
0.000 | 0.395
0.000 | 0.385
0.000 | 0.016
0.029 | 0.226
0.314 | 0.589
| Plot | Mito | Lyso | Perox | ER | Golgi | PM | Cytosol | Nucleus | |||||
| Expt A |
2 peptides |
3 spectra |
|
0.000 0.000 | 0.169 |
0.000 0.000 | 0.000 |
0.000 0.000 | 0.146 |
0.347 0.000 | 0.395 |
0.000 0.000 | 0.385 |
0.000 0.000 | 0.016 |
0.175 0.029 | 0.226 |
0.477 0.314 | 0.589 |
| 2 spectra, LSSGEDTTELR | 0.000 | 0.000 | 0.000 | 0.104 | 0.089 | 0.000 | 0.099 | 0.708 | ||
| 1 spectrum, GDPEAALIQYLTNEEAR | 0.324 | 0.000 | 0.339 | 0.000 | 0.000 | 0.279 | 0.058 | 0.000 |