20
20peptides
spectra
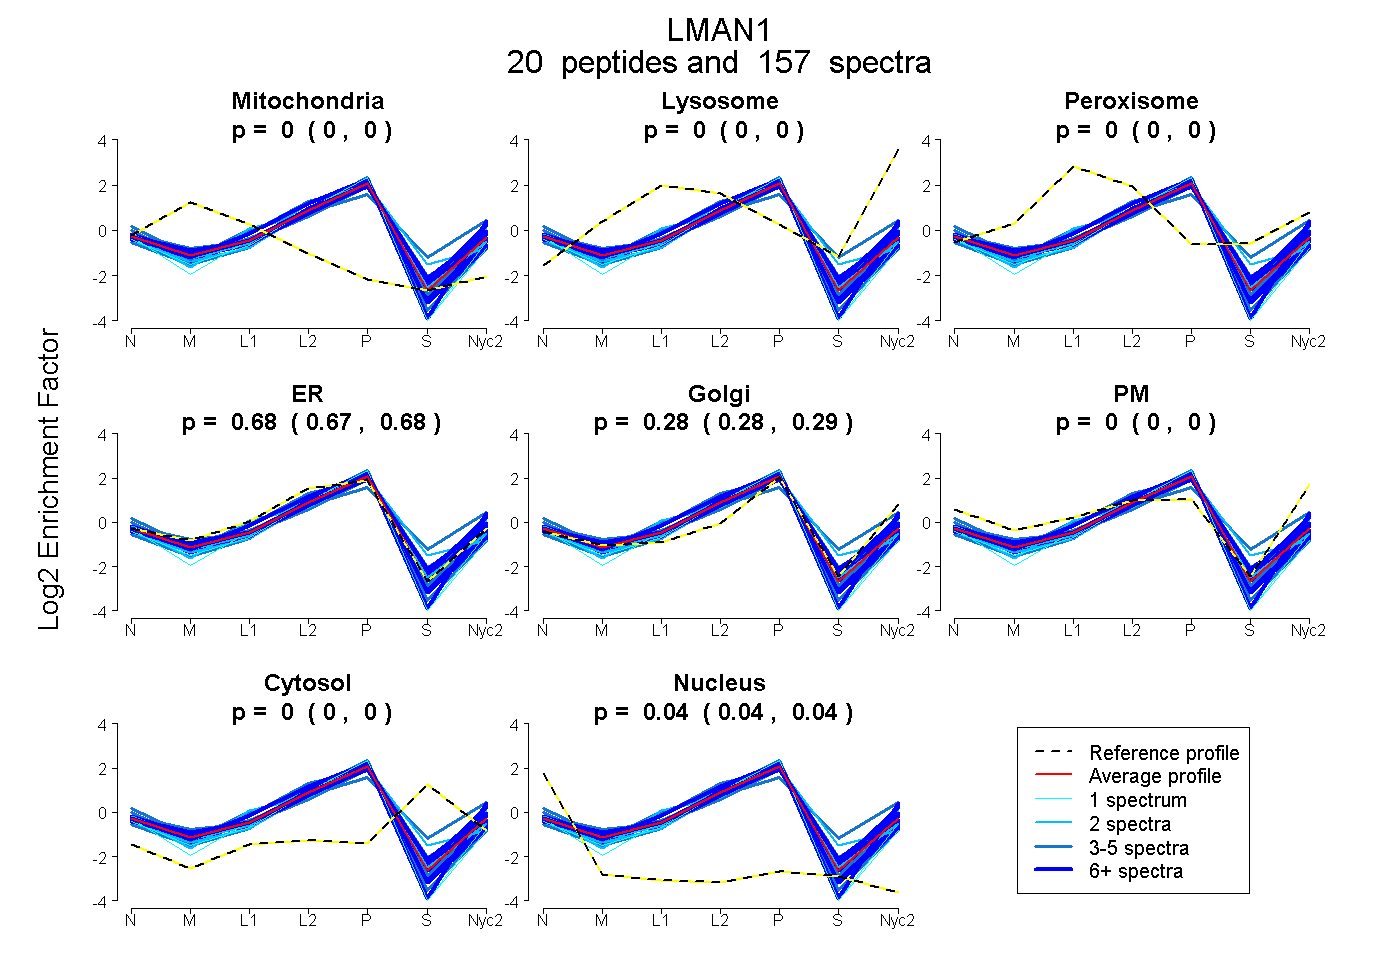
0.000 | 0.000
0.000 | 0.000
0.000 | 0.000
0.673 | 0.680
0.278 | 0.287
0.000 | 0.000
0.000 | 0.000
0.039 | 0.041
12peptides
spectra
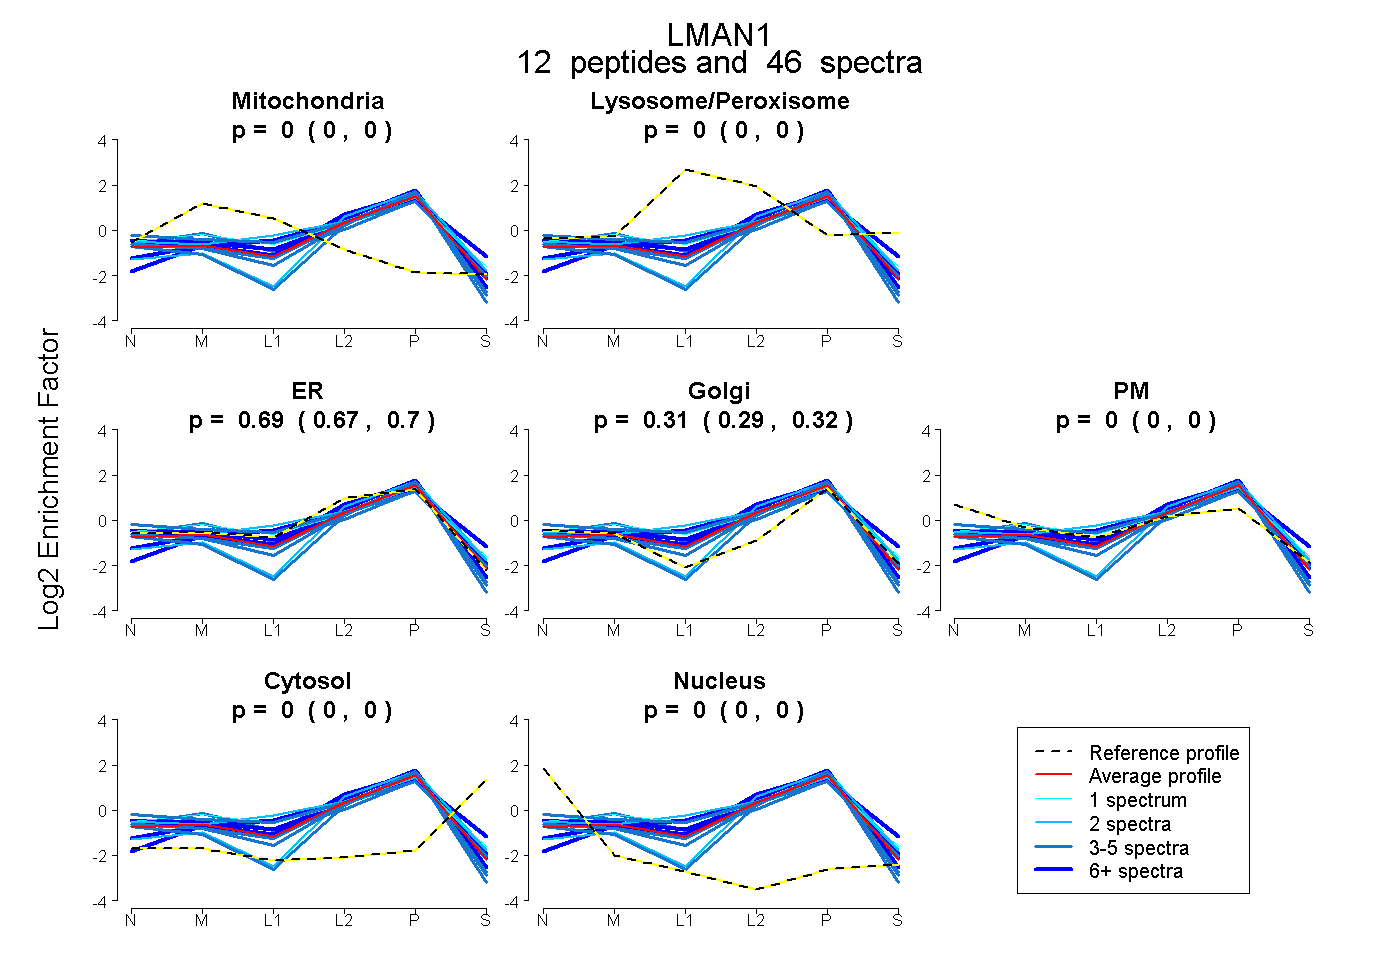
0.000 | 0.000
0.000 | 0.000
0.673 | 0.704
0.294 | 0.324
0.000 | 0.000
0.000 | 0.000
0.000 | 0.000