 20
20peptides
spectra
0.000 | 0.000
0.000 | 0.000
0.000 | 0.000
0.673 | 0.680
0.278 | 0.287
0.000 | 0.000
0.000 | 0.000
0.039 | 0.041
| Plot | Mito | Lyso | Perox | ER | Golgi | PM | Cytosol | Nucleus | |||||
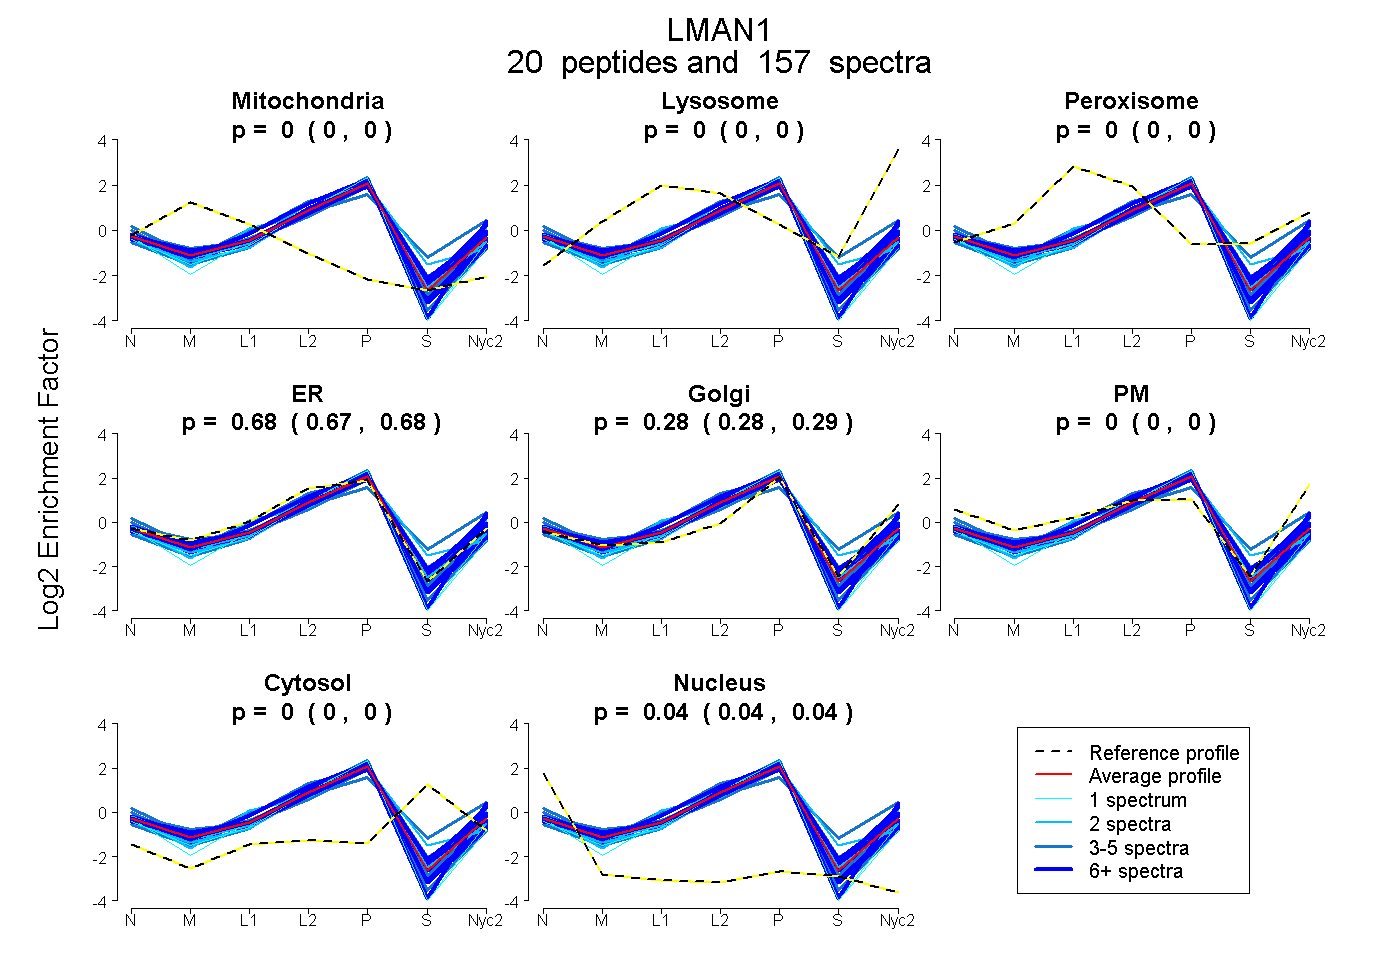
| Expt A |
20 peptides |
157 spectra |
|
0.000 0.000 | 0.000 |
0.000 0.000 | 0.000 |
0.000 0.000 | 0.000 |
0.677 0.673 | 0.680 |
0.283 0.278 | 0.287 |
0.000 0.000 | 0.000 |
0.000 0.000 | 0.000 |
0.040 0.039 | 0.041 |
| 4 spectra, GSVWTK | 0.000 | 0.000 | 0.000 | 0.879 | 0.058 | 0.000 | 0.045 | 0.019 | ||
| 2 spectra, EPPTPEK | 0.000 | 0.000 | 0.000 | 0.472 | 0.494 | 0.000 | 0.034 | 0.000 | ||
| 6 spectra, NSMSETLR | 0.000 | 0.000 | 0.000 | 0.500 | 0.474 | 0.003 | 0.023 | 0.000 | ||
| 8 spectra, TQQEILR | 0.000 | 0.000 | 0.000 | 0.712 | 0.274 | 0.014 | 0.000 | 0.000 | ||
| 12 spectra, IHLELK | 0.000 | 0.000 | 0.000 | 0.736 | 0.209 | 0.000 | 0.000 | 0.054 | ||
| 3 spectra, AAFENWEVEVTFR | 0.000 | 0.000 | 0.000 | 0.763 | 0.136 | 0.000 | 0.098 | 0.003 | ||
| 4 spectra, EHLHIVK | 0.000 | 0.000 | 0.000 | 0.787 | 0.140 | 0.000 | 0.000 | 0.073 | ||
| 8 spectra, DIDSLAQR | 0.000 | 0.000 | 0.000 | 0.780 | 0.148 | 0.000 | 0.000 | 0.072 | ||
| 5 spectra, ITYYQK | 0.007 | 0.000 | 0.000 | 0.605 | 0.331 | 0.000 | 0.000 | 0.057 | ||
| 1 spectrum, YQEEFEHFQQELDK | 0.000 | 0.000 | 0.000 | 0.853 | 0.059 | 0.000 | 0.000 | 0.088 | ||
| 12 spectra, QVFEGQNR | 0.000 | 0.000 | 0.000 | 0.738 | 0.189 | 0.000 | 0.000 | 0.072 | ||
| 1 spectrum, SMSSNEKPK | 0.000 | 0.000 | 0.000 | 0.724 | 0.218 | 0.000 | 0.000 | 0.058 | ||
| 8 spectra, IAPSLK | 0.000 | 0.000 | 0.000 | 0.689 | 0.264 | 0.000 | 0.000 | 0.047 | ||
| 8 spectra, YVSSLTEEISR | 0.000 | 0.000 | 0.000 | 0.613 | 0.329 | 0.000 | 0.057 | 0.000 | ||
| 19 spectra, QLDMILDEQR | 0.000 | 0.000 | 0.000 | 0.596 | 0.377 | 0.000 | 0.000 | 0.026 | ||
| 28 spectra, QVNEMK | 0.000 | 0.000 | 0.000 | 0.605 | 0.317 | 0.000 | 0.074 | 0.005 | ||
| 4 spectra, GHPDLQGQPADDIFESIGDR | 0.000 | 0.000 | 0.000 | 0.354 | 0.156 | 0.308 | 0.183 | 0.000 | ||
| 2 spectra, NDYEFCAK | 0.000 | 0.000 | 0.000 | 0.801 | 0.000 | 0.000 | 0.199 | 0.000 | ||
| 20 spectra, NKPYPVR | 0.000 | 0.000 | 0.000 | 0.690 | 0.259 | 0.000 | 0.000 | 0.051 | ||
| 2 spectra, TQQEAAAK | 0.000 | 0.000 | 0.000 | 0.795 | 0.150 | 0.000 | 0.000 | 0.055 |
| Plot | Mito | Lyso or Perox | ER | Golgi | PM | Cytosol | Nucleus | ||||||
| Expt B |
12 peptides |
46 spectra |
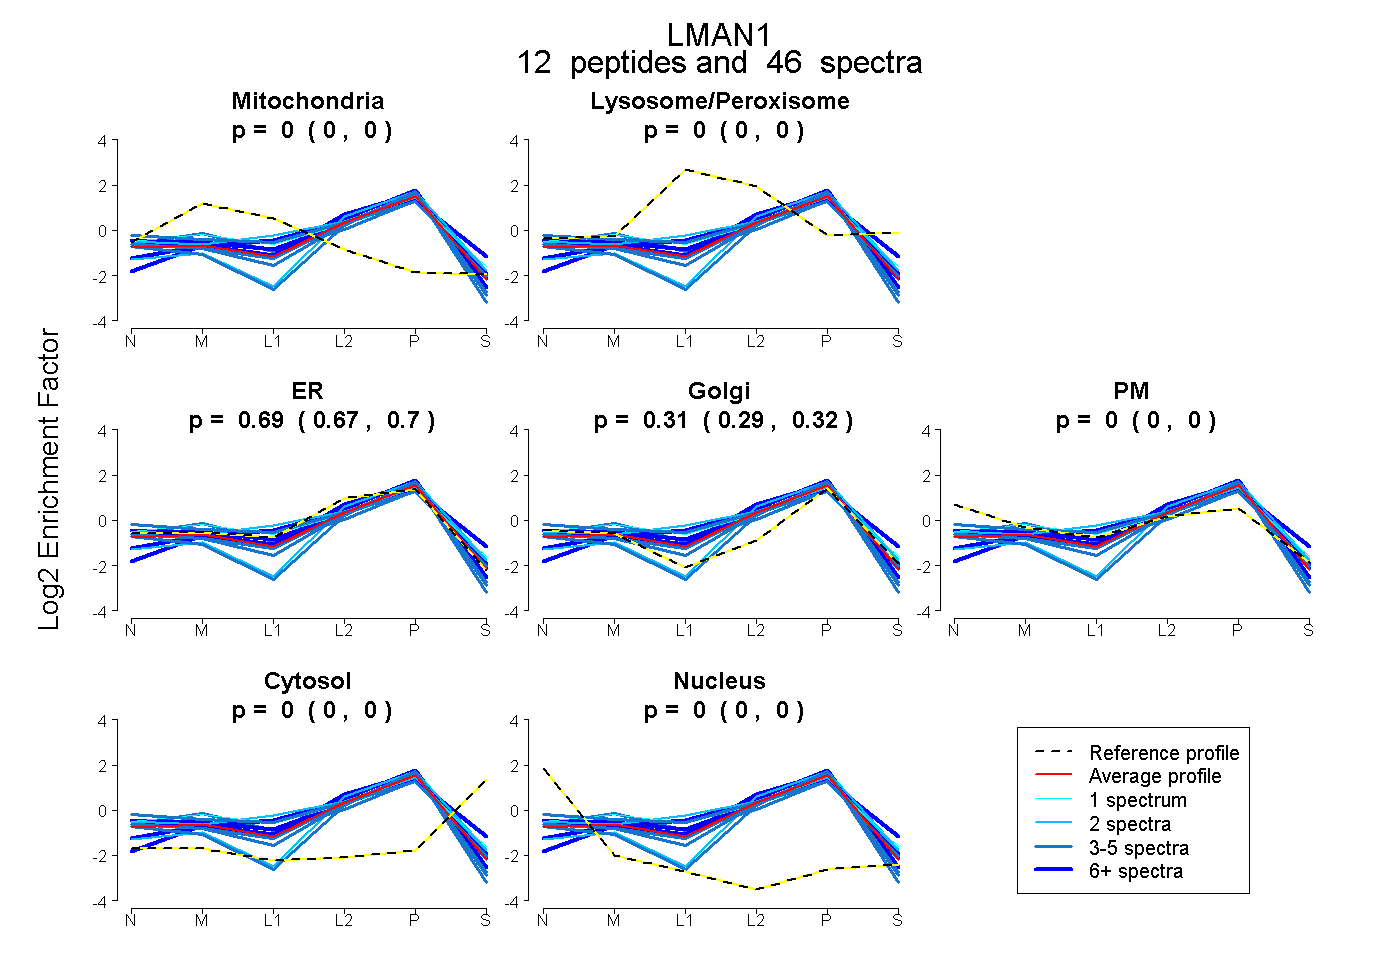 |
0.000 0.000 | 0.000 |
0.000 0.000 | 0.000 |
0.690 0.673 | 0.704 |
0.310 0.294 | 0.324 |
0.000 0.000 | 0.000 |
0.000 0.000 | 0.000 |
0.000 0.000 | 0.000 |
|||
| Plot | Lyso | Other | |||||||||||
| Expt C |
19 peptides |
281 spectra |
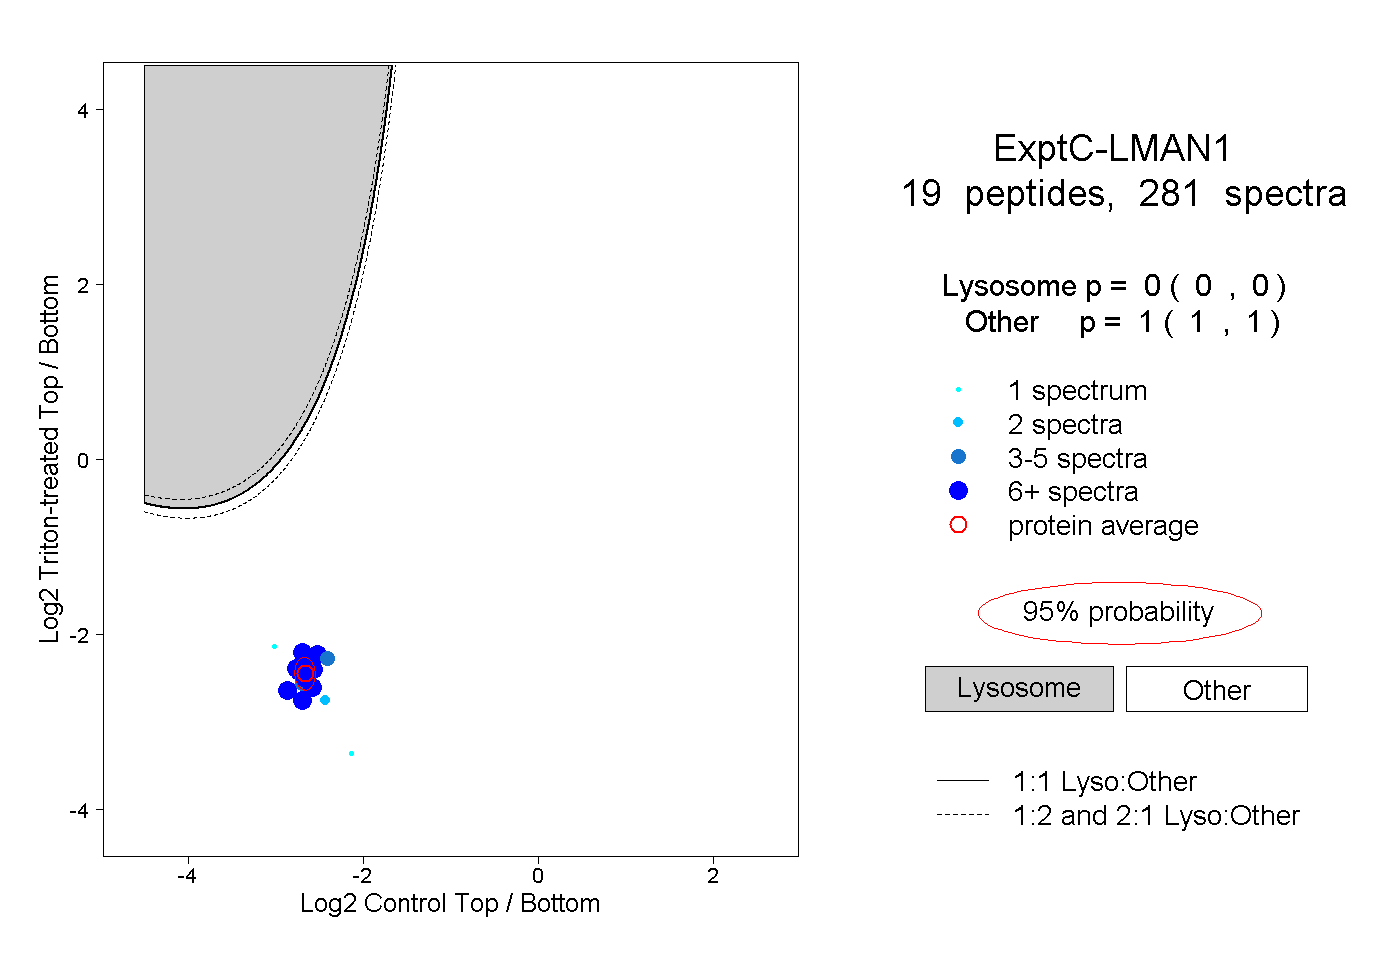 |
0.000 0.000 | 0.000 |
1.000 1.000 | 1.000 |
||||||||
| Plot | Lyso | Other | |||||||||||
| Expt D |
11 peptides |
23 spectra |
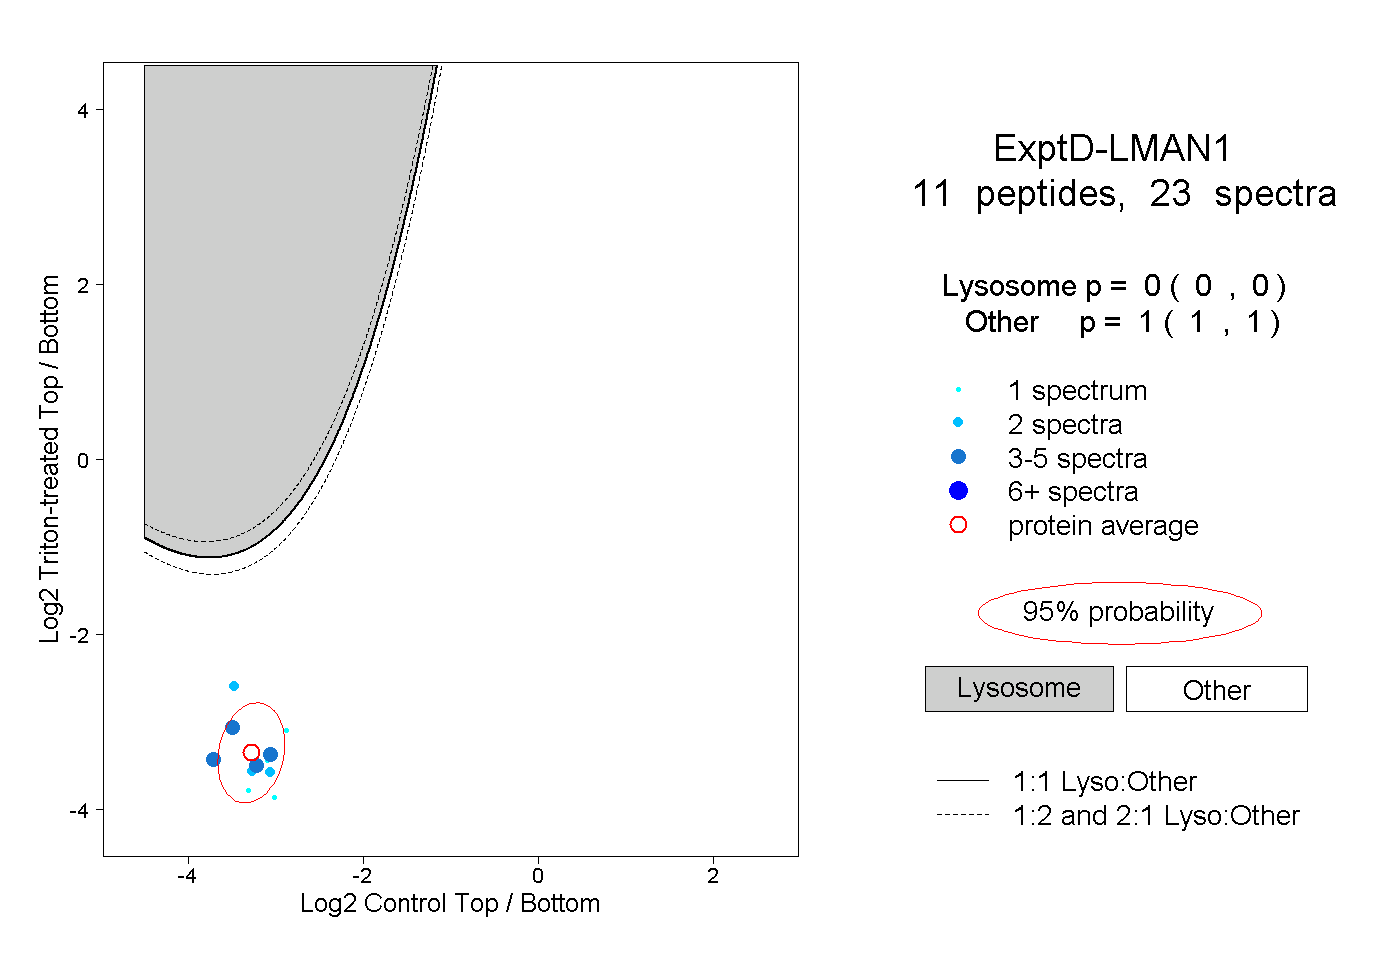 |
0.000 0.000 | 0.000 |
1.000 1.000 | 1.000 |