 2
2peptides
spectra
0.000 | 0.058
0.000 | 0.000
0.000 | 0.000
0.366 | 0.571
0.000 | 0.178
0.000 | 0.000
0.306 | 0.483
0.000 | 0.094
3peptides
spectra
0.000 | 0.000
1.000 | 1.000
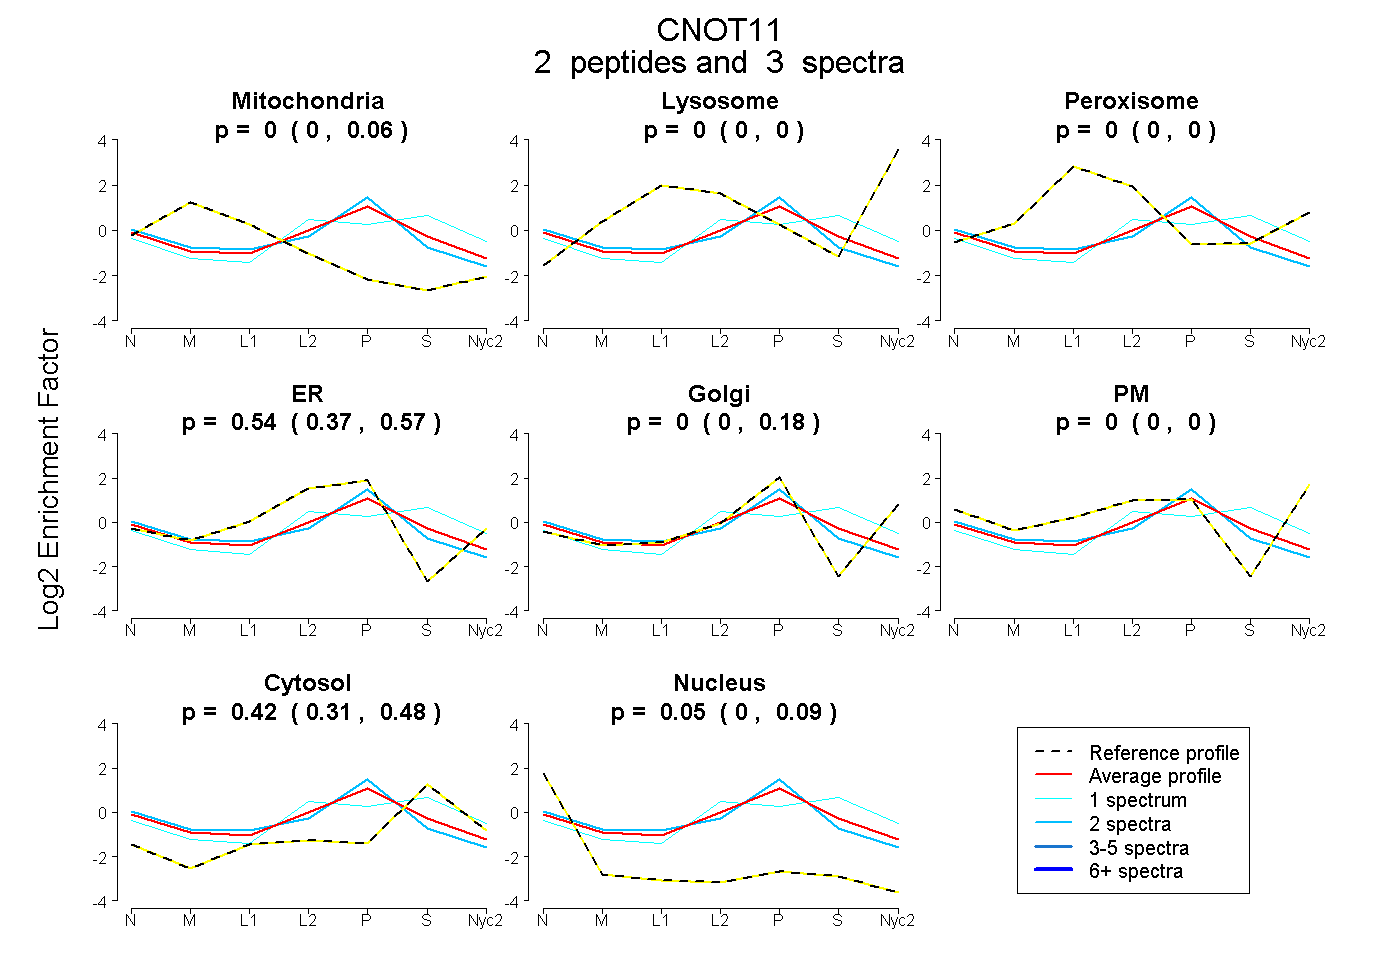
| Plot | Mito | Lyso | Perox | ER | Golgi | PM | Cytosol | Nucleus | |||||
| Expt A |
2 peptides |
3 spectra |
|
0.000 0.000 | 0.058 |
0.000 0.000 | 0.000 |
0.000 0.000 | 0.000 |
0.536 0.366 | 0.571 |
0.002 0.000 | 0.178 |
0.000 0.000 | 0.000 |
0.416 0.306 | 0.483 |
0.047 0.000 | 0.094 |
||
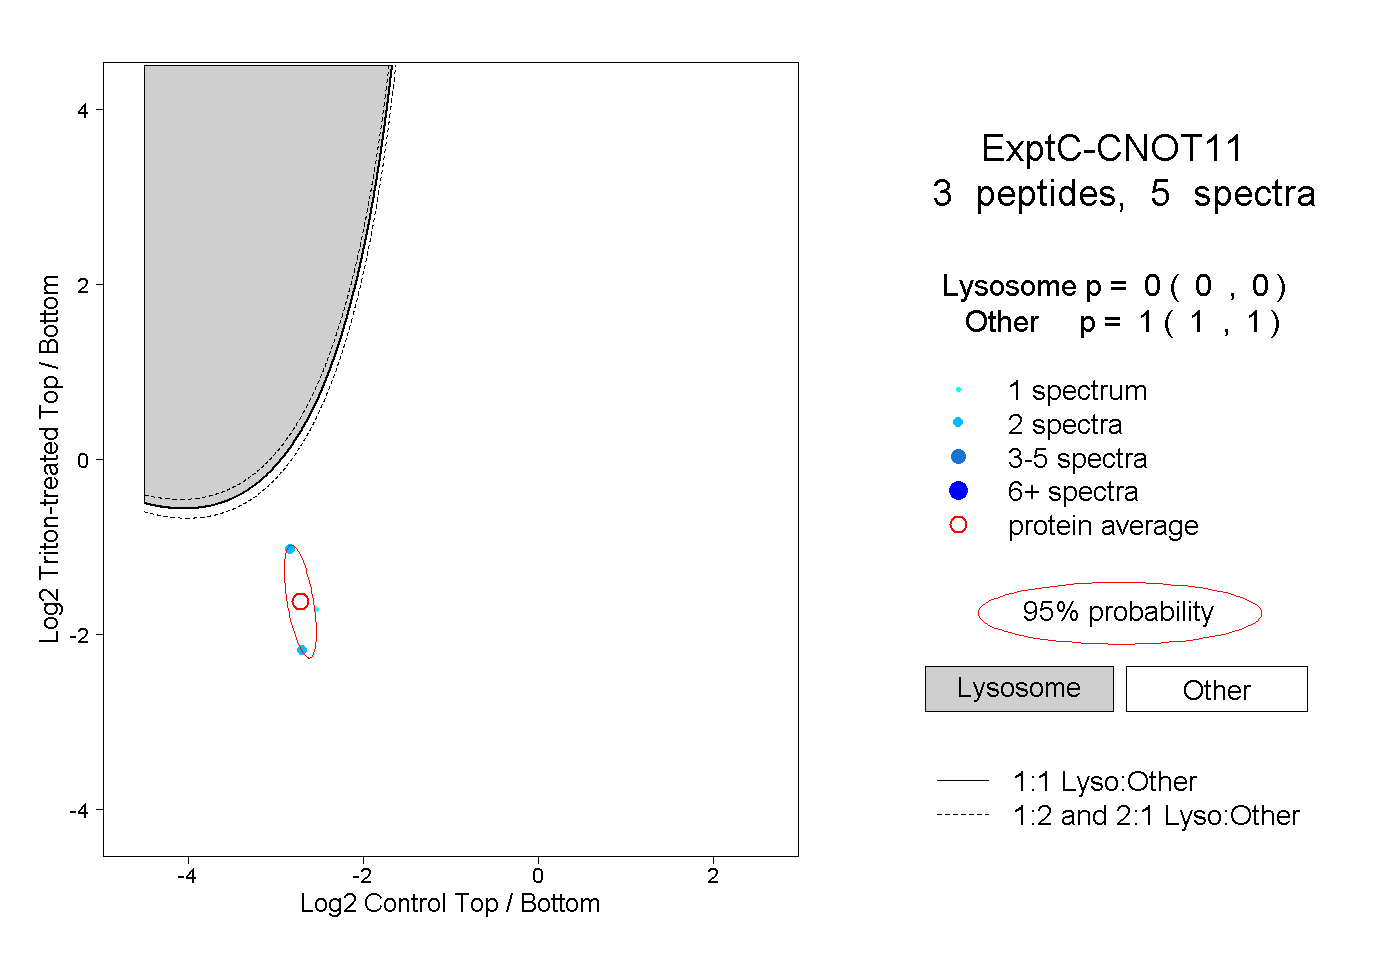
| Plot | Lyso | Other | |||||||||||
| Expt C |
3 peptides |
5 spectra |
|
0.000 0.000 | 0.000 |
1.000 1.000 | 1.000 |