9
9peptides
spectra
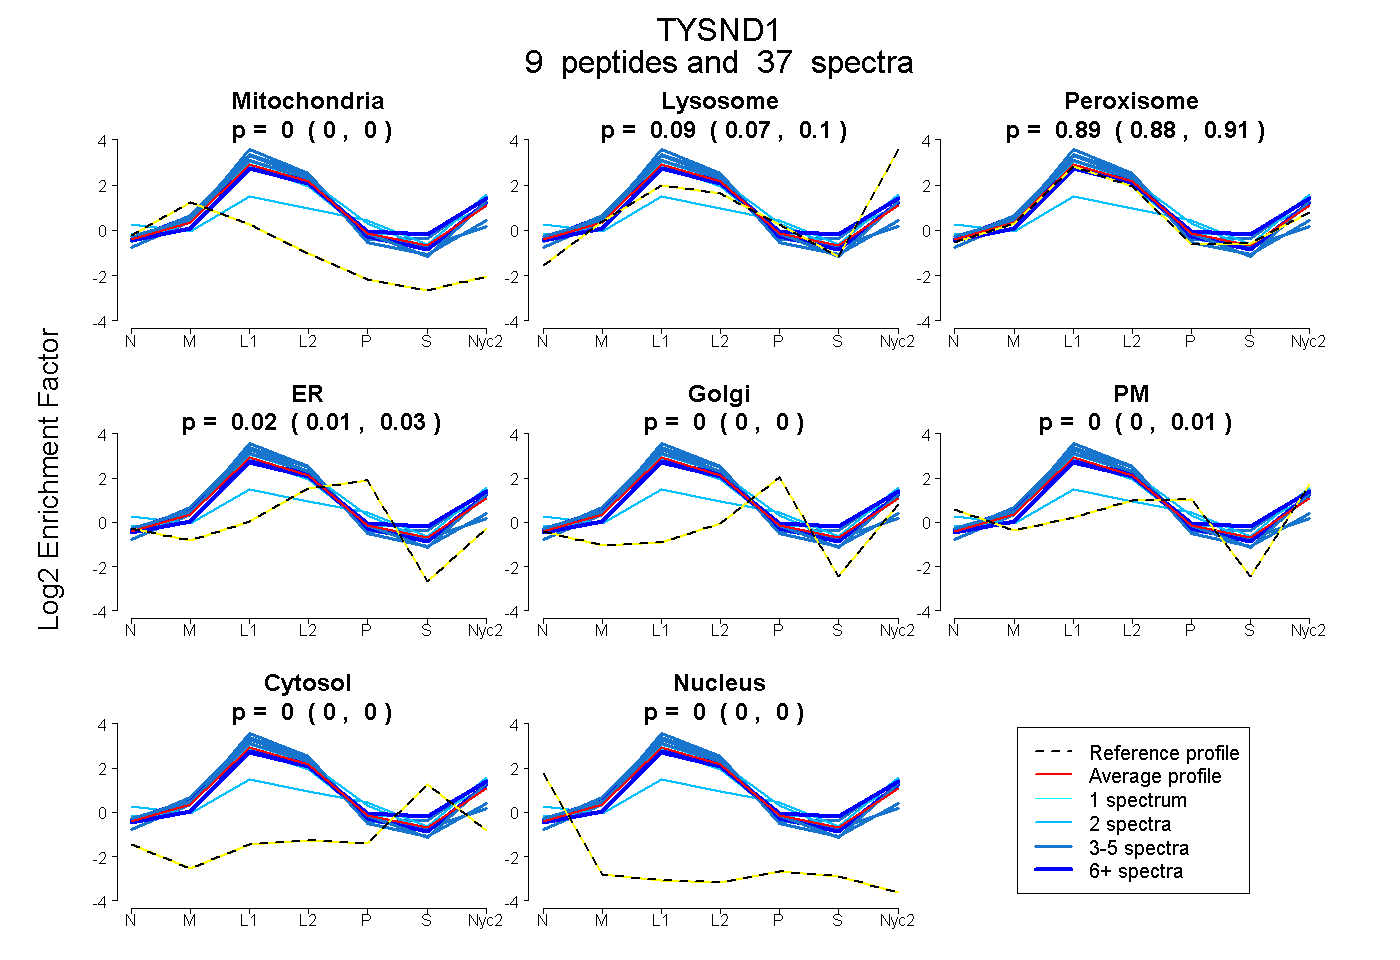
0.000 | 0.000
0.072 | 0.101
0.877 | 0.908
0.007 | 0.026
0.000 | 0.000
0.000 | 0.006
0.000 | 0.000
0.000 | 0.000
4peptides
spectra
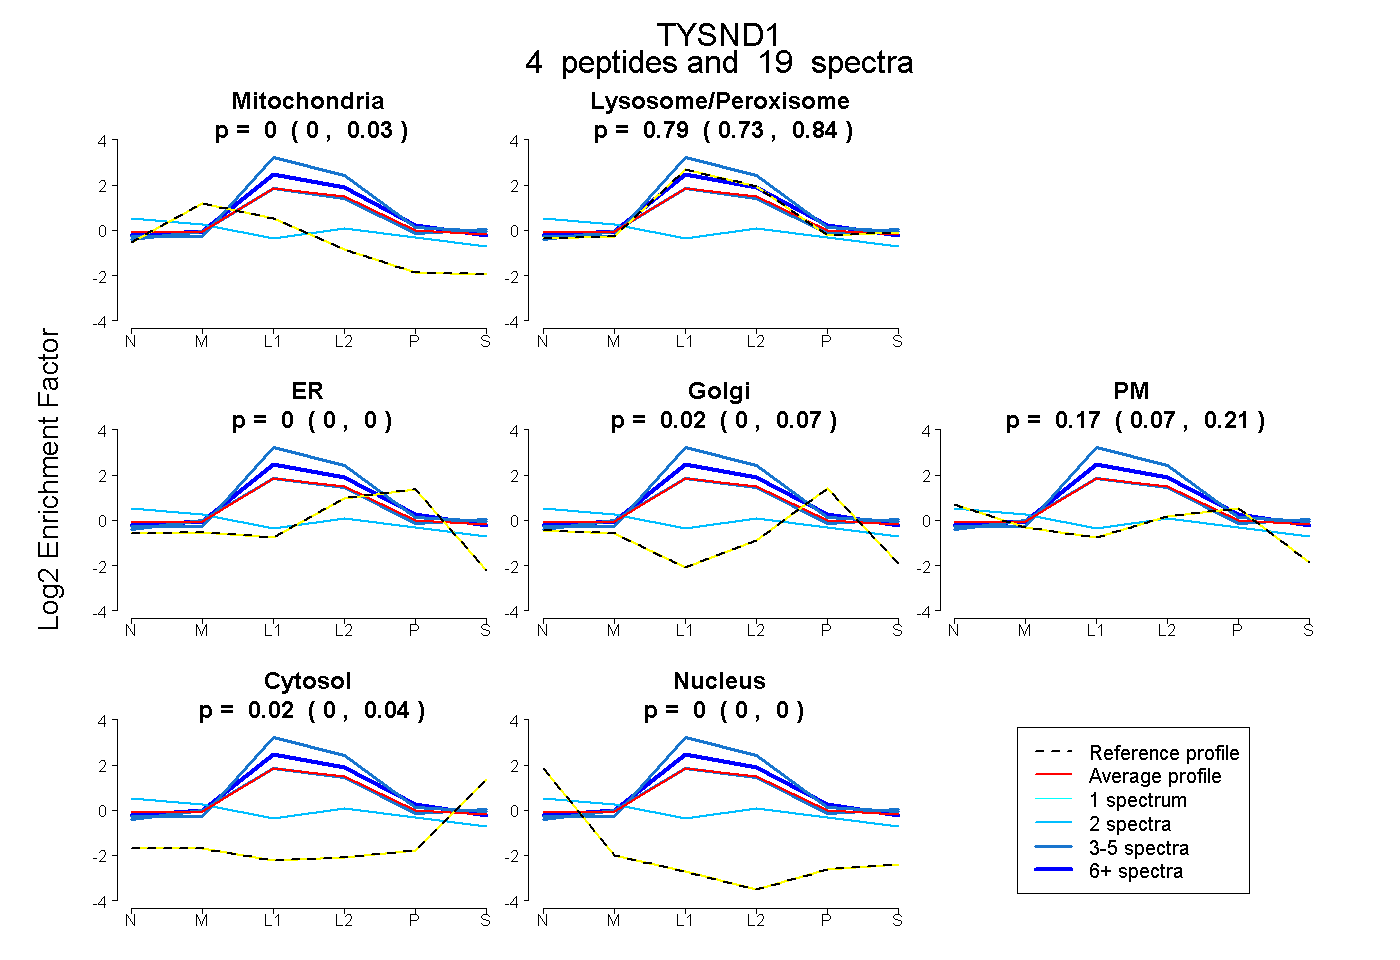
0.000 | 0.029
0.726 | 0.842
0.000 | 0.000
0.000 | 0.067
0.066 | 0.215
0.000 | 0.044
0.000 | 0.000
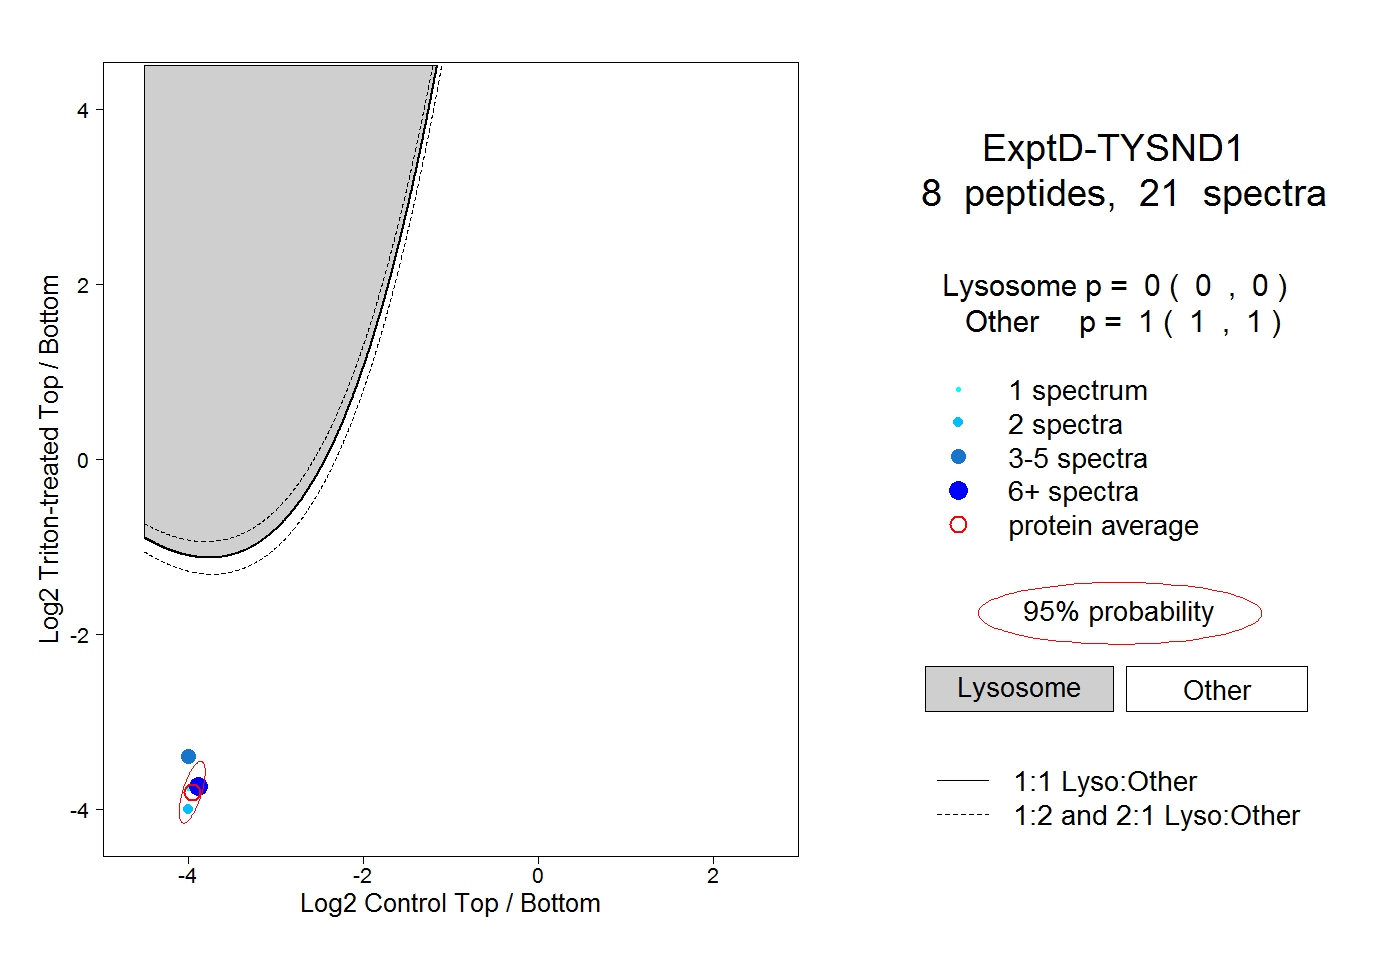
16peptides
spectra
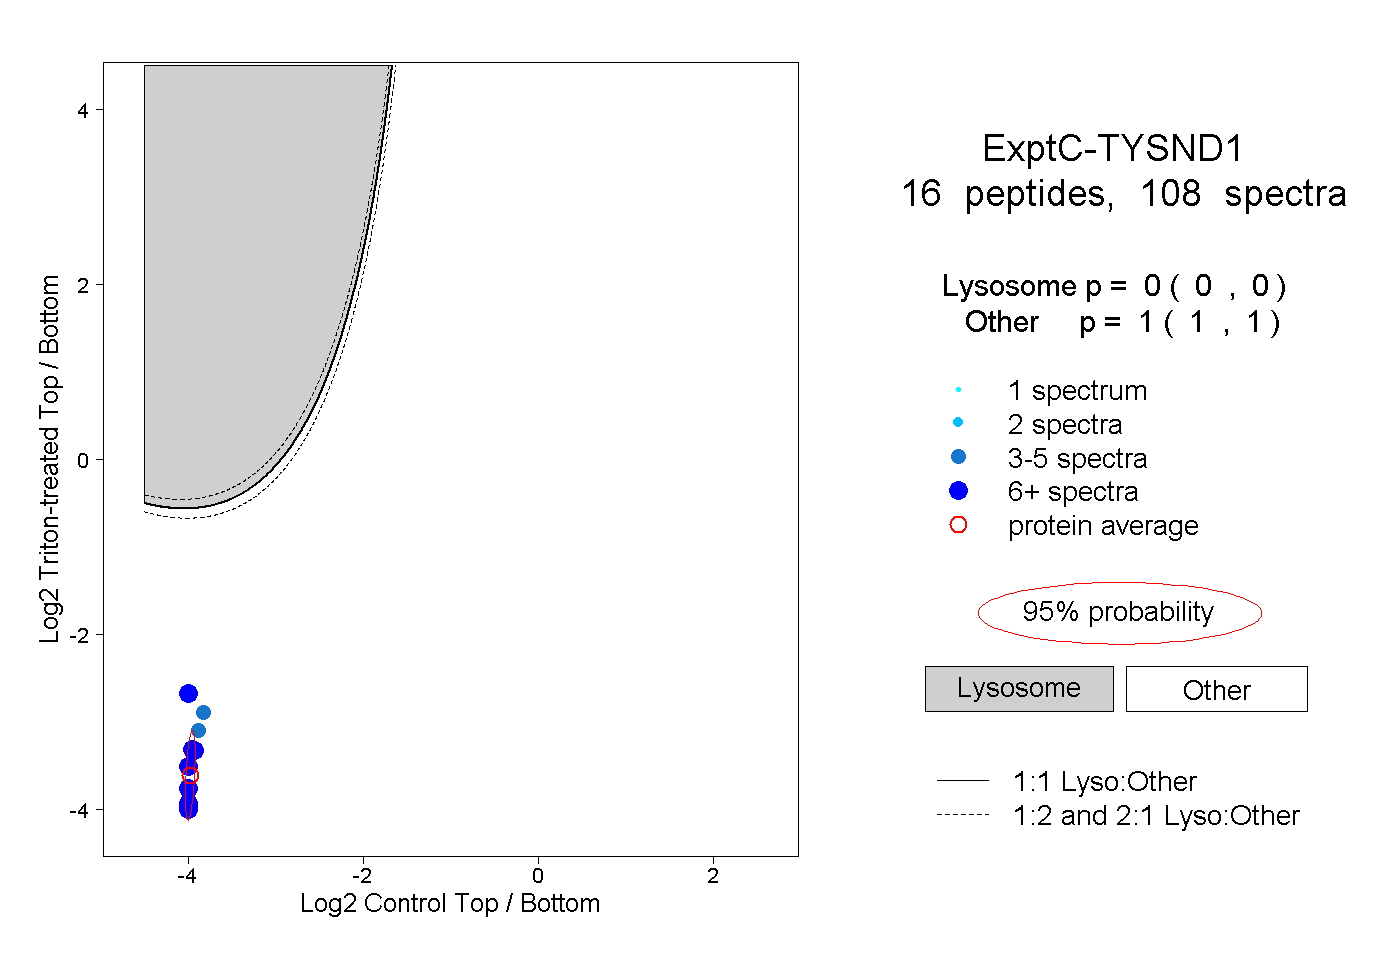
0.000 | 0.000
1.000 | 1.000