 9
9peptides
spectra
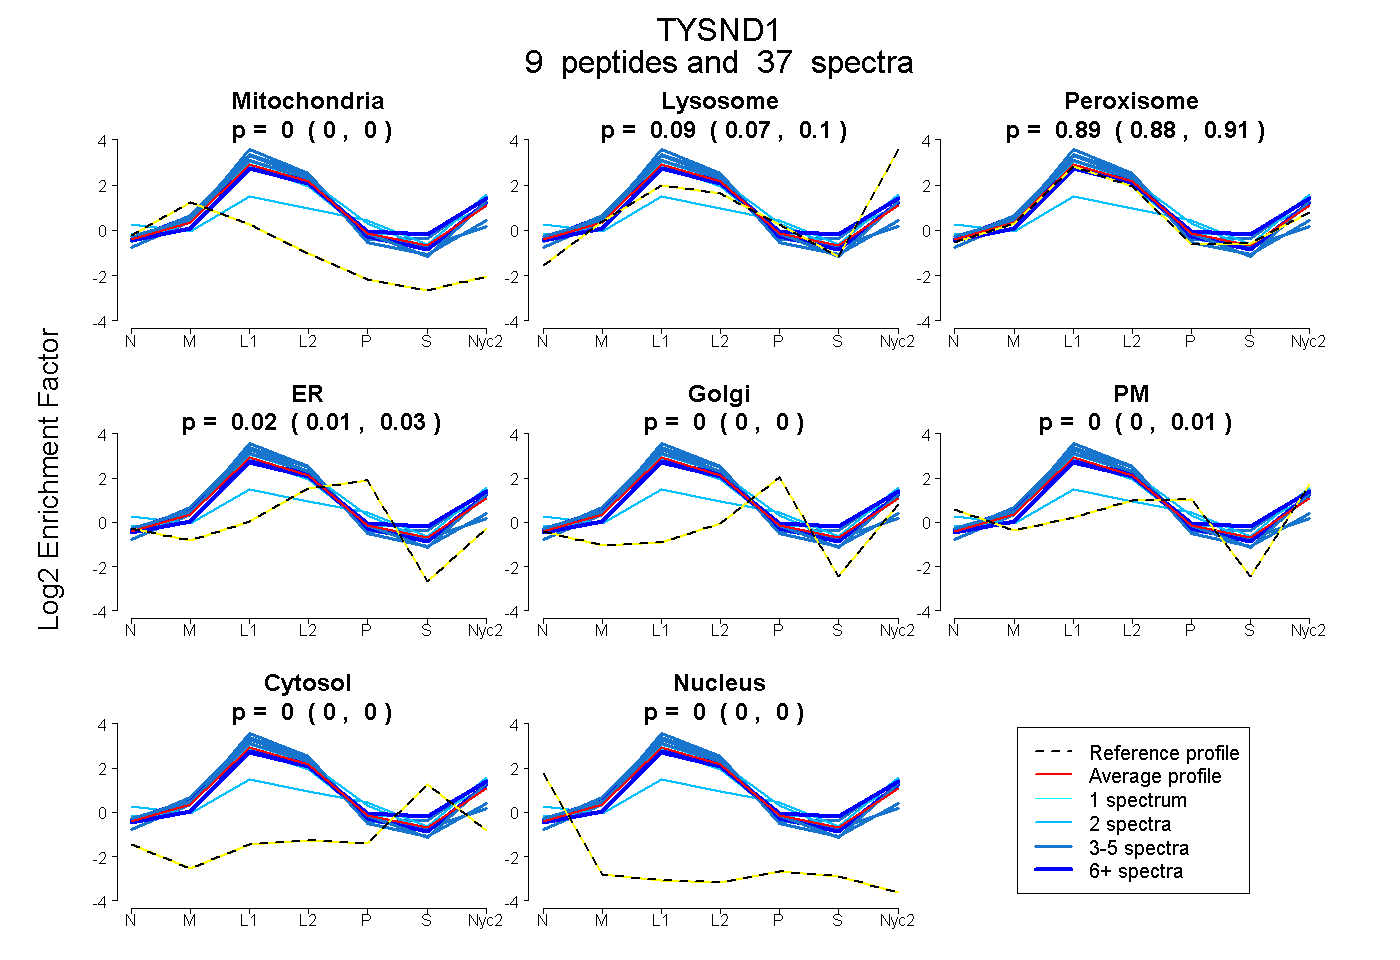
0.000 | 0.000
0.072 | 0.101
0.877 | 0.908
0.007 | 0.026
0.000 | 0.000
0.000 | 0.006
0.000 | 0.000
0.000 | 0.000
| Plot | Mito | Lyso | Perox | ER | Golgi | PM | Cytosol | Nucleus | |||||
| Expt A |
9 peptides |
37 spectra |
|
0.000 0.000 | 0.000 |
0.089 0.072 | 0.101 |
0.893 0.877 | 0.908 |
0.018 0.007 | 0.026 |
0.000 0.000 | 0.000 |
0.000 0.000 | 0.006 |
0.000 0.000 | 0.000 |
0.000 0.000 | 0.000 |
| 2 spectra, ELDHTTEPVR | 0.000 | 0.042 | 0.927 | 0.000 | 0.000 | 0.031 | 0.000 | 0.000 | ||
| 3 spectra, GVLSNAAGPLLLTDAR | 0.000 | 0.134 | 0.866 | 0.000 | 0.000 | 0.000 | 0.000 | 0.000 | ||
| 5 spectra, VAEQAGCVVSASR | 0.000 | 0.000 | 1.000 | 0.000 | 0.000 | 0.000 | 0.000 | 0.000 | ||
| 5 spectra, LVVTCR | 0.000 | 0.000 | 1.000 | 0.000 | 0.000 | 0.000 | 0.000 | 0.000 | ||
| 7 spectra, NVAIWGR | 0.000 | 0.124 | 0.841 | 0.000 | 0.000 | 0.034 | 0.000 | 0.000 | ||
| 7 spectra, VLVHSATPR | 0.000 | 0.173 | 0.824 | 0.000 | 0.000 | 0.000 | 0.003 | 0.000 | ||
| 4 spectra, QYSQTGDLCGLR | 0.000 | 0.121 | 0.847 | 0.000 | 0.000 | 0.032 | 0.000 | 0.000 | ||
| 2 spectra, LQRPLPEAPR | 0.000 | 0.112 | 0.406 | 0.000 | 0.000 | 0.402 | 0.080 | 0.000 | ||
| 2 spectra, LHVQWGPTAASPAGR | 0.000 | 0.163 | 0.785 | 0.052 | 0.000 | 0.000 | 0.000 | 0.000 |
| Plot | Mito | Lyso or Perox | ER | Golgi | PM | Cytosol | Nucleus | ||||||
| Expt B |
4 peptides |
19 spectra |
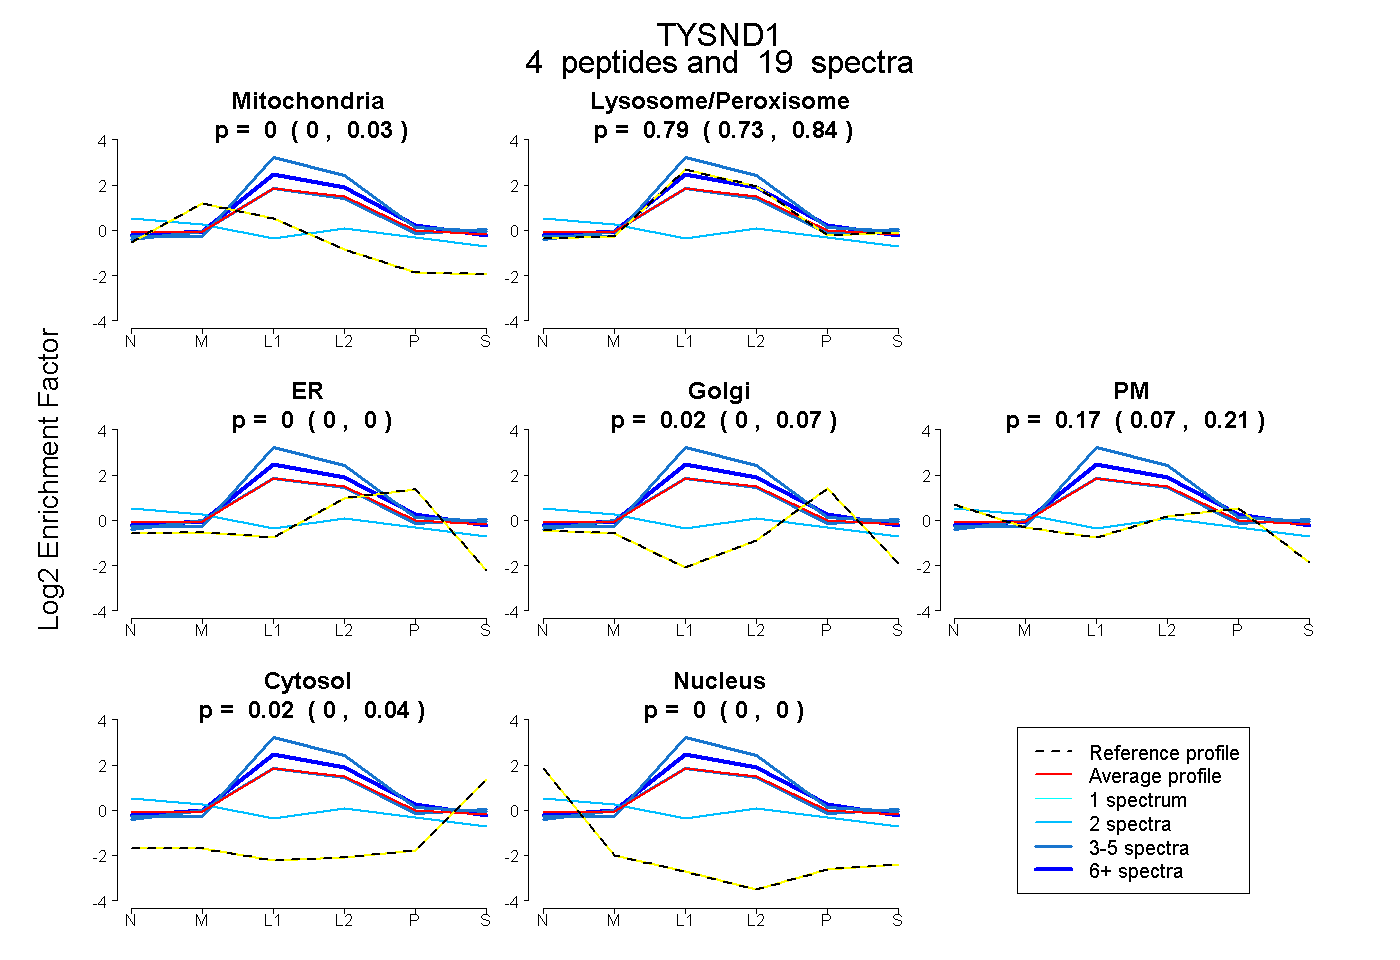 |
0.000 0.000 | 0.029 |
0.790 0.726 | 0.842 |
0.000 0.000 | 0.000 |
0.019 0.000 | 0.067 |
0.167 0.066 | 0.215 |
0.025 0.000 | 0.044 |
0.000 0.000 | 0.000 |
|||
| Plot | Lyso | Other | |||||||||||
| Expt C |
16 peptides |
108 spectra |
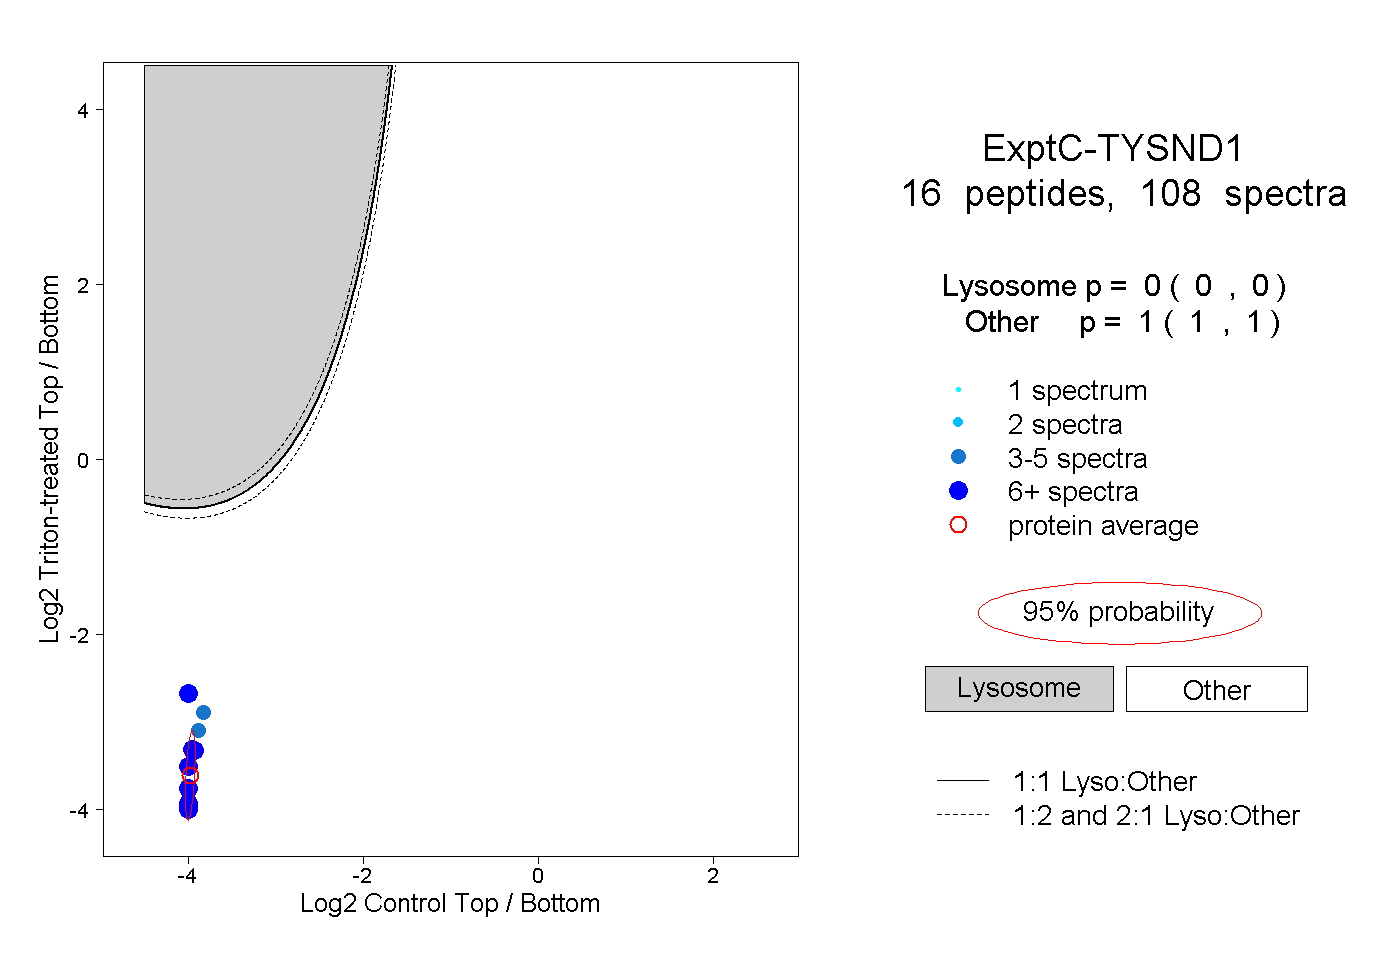 |
0.000 0.000 | 0.000 |
1.000 1.000 | 1.000 |
||||||||
| Plot | Lyso | Other | |||||||||||
| Expt D |
8 peptides |
21 spectra |
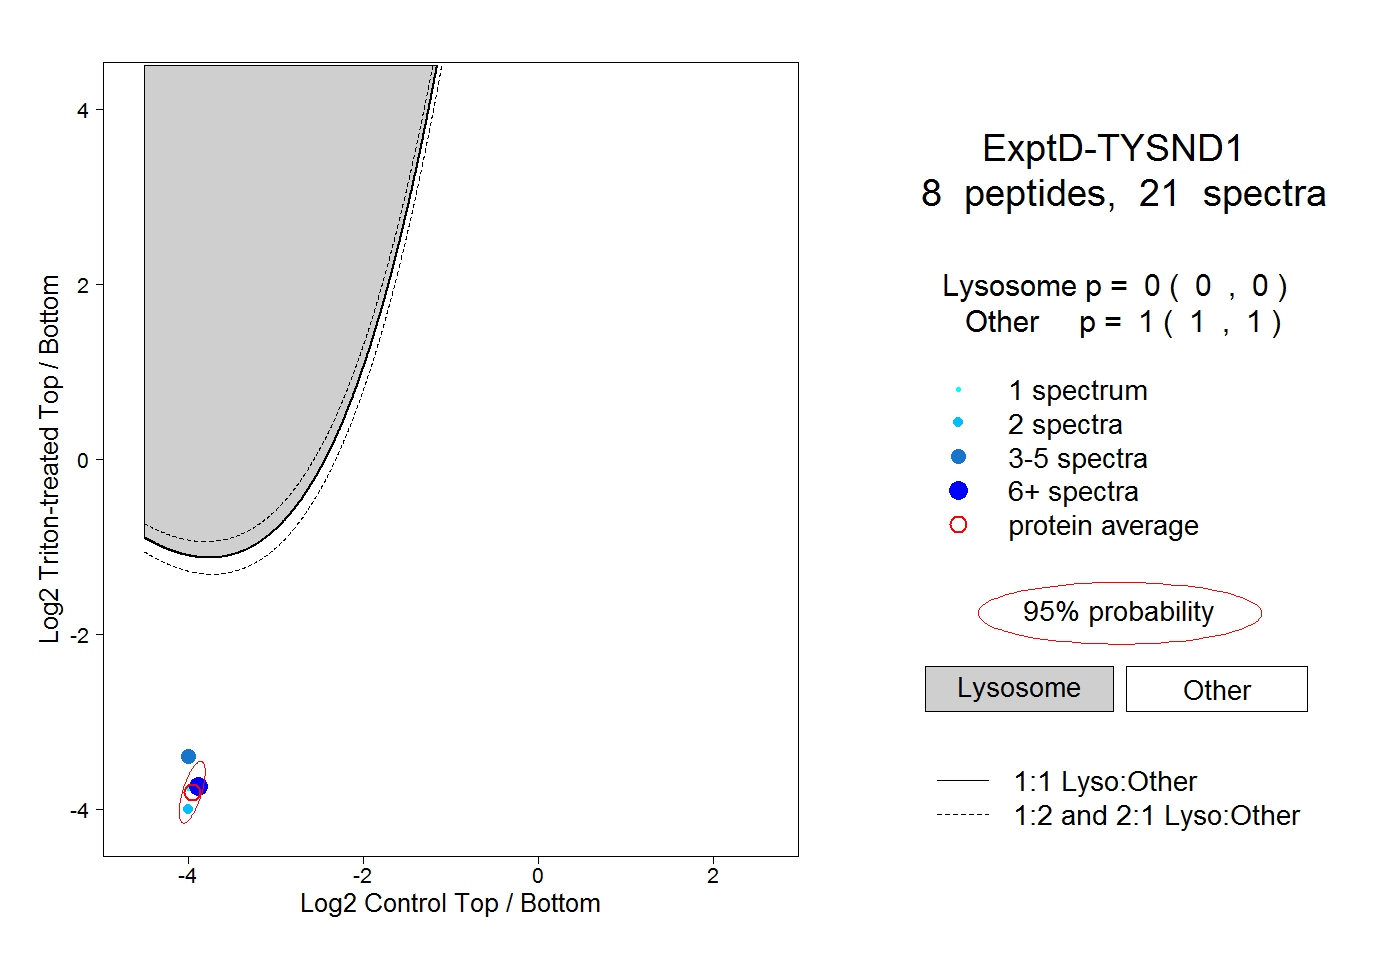 |
0.000 0.000 | 0.000 |
1.000 1.000 | 1.000 |