 14
14peptides
spectra
0.000 | 0.000
0.000 | 0.000
0.000 | 0.000
0.000 | 0.000
0.000 | 0.022
0.000 | 0.026
0.969 | 0.979
0.000 | 0.005
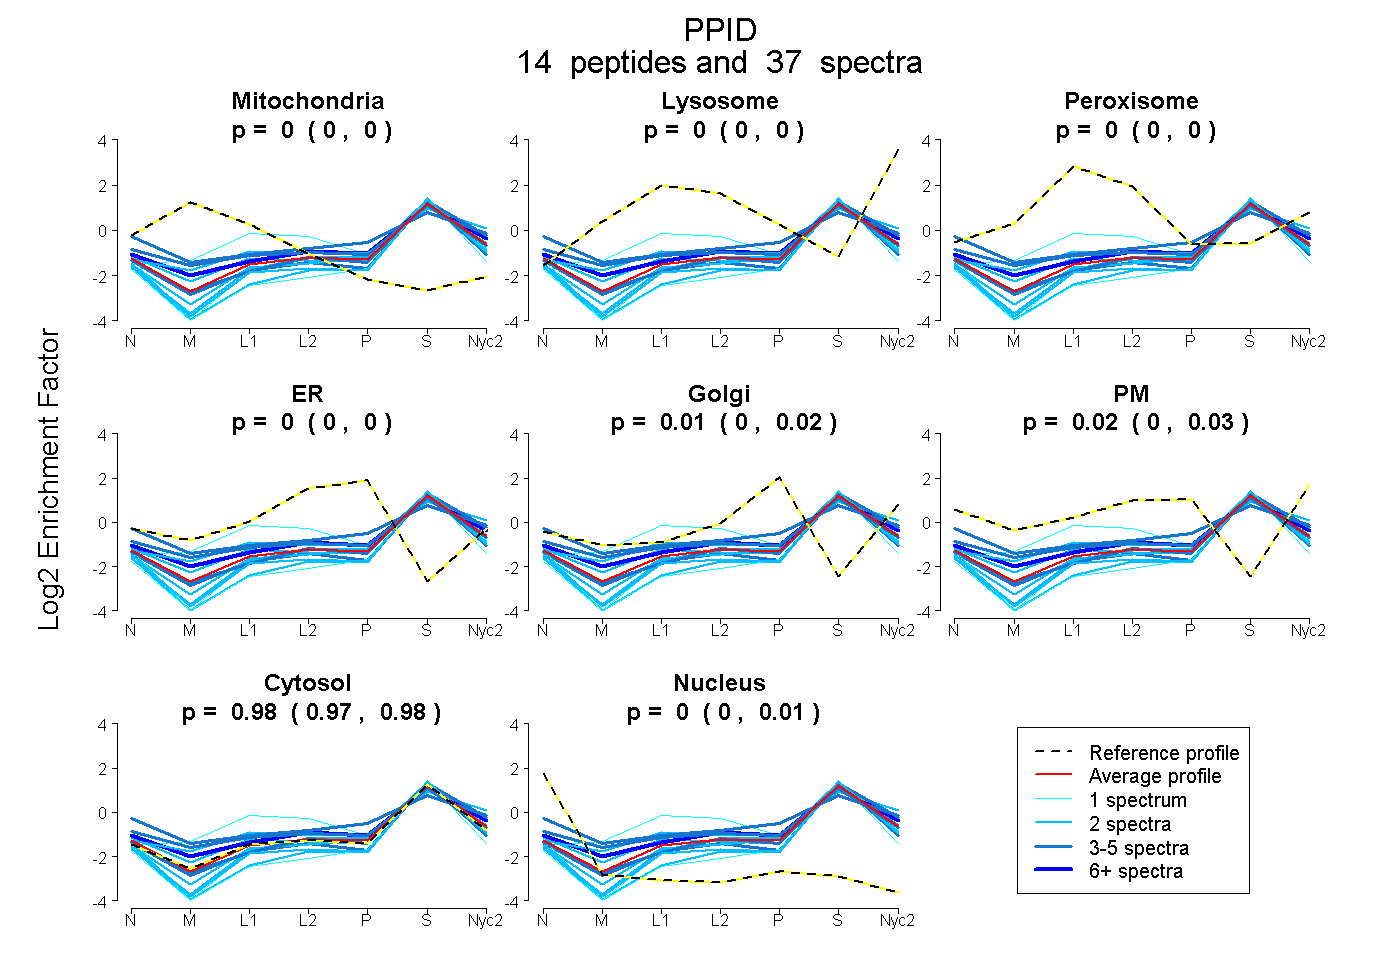
| Plot | Mito | Lyso | Perox | ER | Golgi | PM | Cytosol | Nucleus | |||||
| Expt A |
14 peptides |
37 spectra |
|
0.000 0.000 | 0.000 |
0.000 0.000 | 0.000 |
0.000 0.000 | 0.000 |
0.000 0.000 | 0.000 |
0.008 0.000 | 0.022 |
0.015 0.000 | 0.026 |
0.975 0.969 | 0.979 |
0.001 0.000 | 0.005 |
| 2 spectra, FEDENFHYK | 0.000 | 0.000 | 0.000 | 0.000 | 0.000 | 0.000 | 1.000 | 0.000 | ||
| 1 spectrum, MLENVEVNGEKPAK | 0.000 | 0.000 | 0.000 | 0.000 | 0.000 | 0.000 | 0.911 | 0.089 | ||
| 1 spectrum, EYDQALADLK | 0.000 | 0.067 | 0.241 | 0.000 | 0.000 | 0.000 | 0.692 | 0.000 | ||
| 5 spectra, AQEIAPGDK | 0.000 | 0.000 | 0.000 | 0.000 | 0.000 | 0.000 | 0.957 | 0.043 | ||
| 2 spectra, AIQAELLK | 0.000 | 0.000 | 0.000 | 0.000 | 0.000 | 0.000 | 0.931 | 0.069 | ||
| 3 spectra, YLDSSK | 0.060 | 0.000 | 0.065 | 0.000 | 0.000 | 0.060 | 0.815 | 0.000 | ||
| 3 spectra, NIGNTFFK | 0.004 | 0.000 | 0.009 | 0.000 | 0.000 | 0.276 | 0.712 | 0.000 | ||
| 3 spectra, SQNWEMAIK | 0.000 | 0.012 | 0.000 | 0.000 | 0.000 | 0.006 | 0.982 | 0.000 | ||
| 8 spectra, HVVFGQVIK | 0.000 | 0.029 | 0.000 | 0.000 | 0.000 | 0.101 | 0.870 | 0.000 | ||
| 2 spectra, LCVIAECGELK | 0.006 | 0.169 | 0.000 | 0.000 | 0.011 | 0.000 | 0.815 | 0.000 | ||
| 2 spectra, VFFDVDIGGER | 0.000 | 0.000 | 0.000 | 0.000 | 0.000 | 0.000 | 0.953 | 0.047 | ||
| 2 spectra, GLGVAR | 0.012 | 0.031 | 0.012 | 0.000 | 0.000 | 0.000 | 0.939 | 0.006 | ||
| 1 spectrum, IVLELFADIVPK | 0.000 | 0.000 | 0.000 | 0.000 | 0.000 | 0.000 | 0.948 | 0.052 | ||
| 2 spectra, AQGWQGLK | 0.000 | 0.000 | 0.000 | 0.000 | 0.000 | 0.000 | 0.997 | 0.003 |
| Plot | Mito | Lyso or Perox | ER | Golgi | PM | Cytosol | Nucleus | ||||||
| Expt B |
4 peptides |
8 spectra |
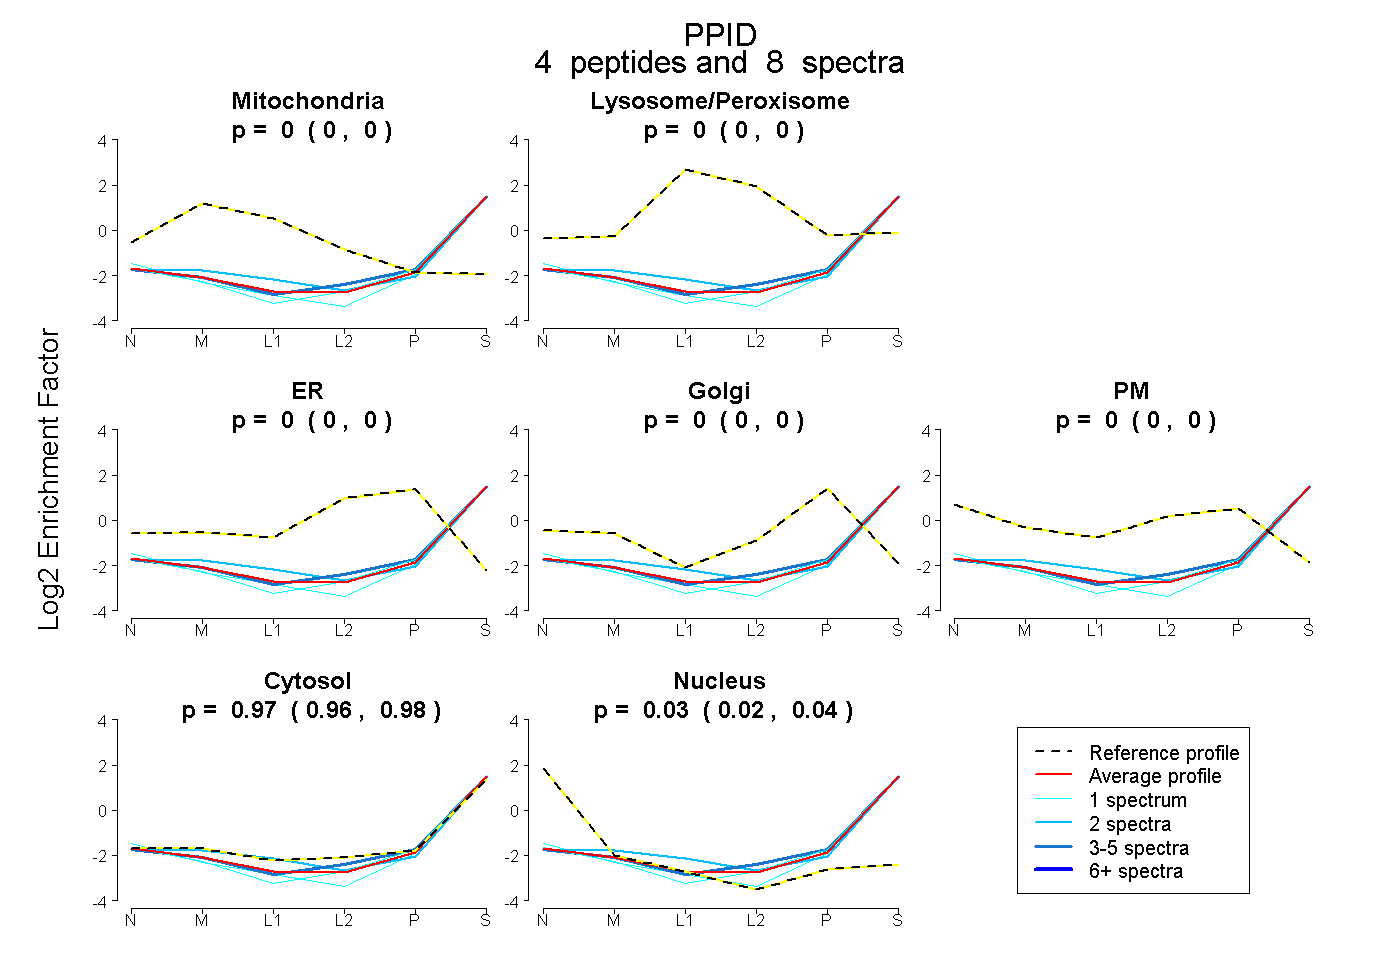 |
0.000 0.000 | 0.000 |
0.000 0.000 | 0.000 |
0.000 0.000 | 0.000 |
0.000 0.000 | 0.000 |
0.000 0.000 | 0.000 |
0.970 0.961 | 0.976 |
0.030 0.022 | 0.037 |
|||
| Plot | Lyso | Other | |||||||||||
| Expt C |
13 peptides |
55 spectra |
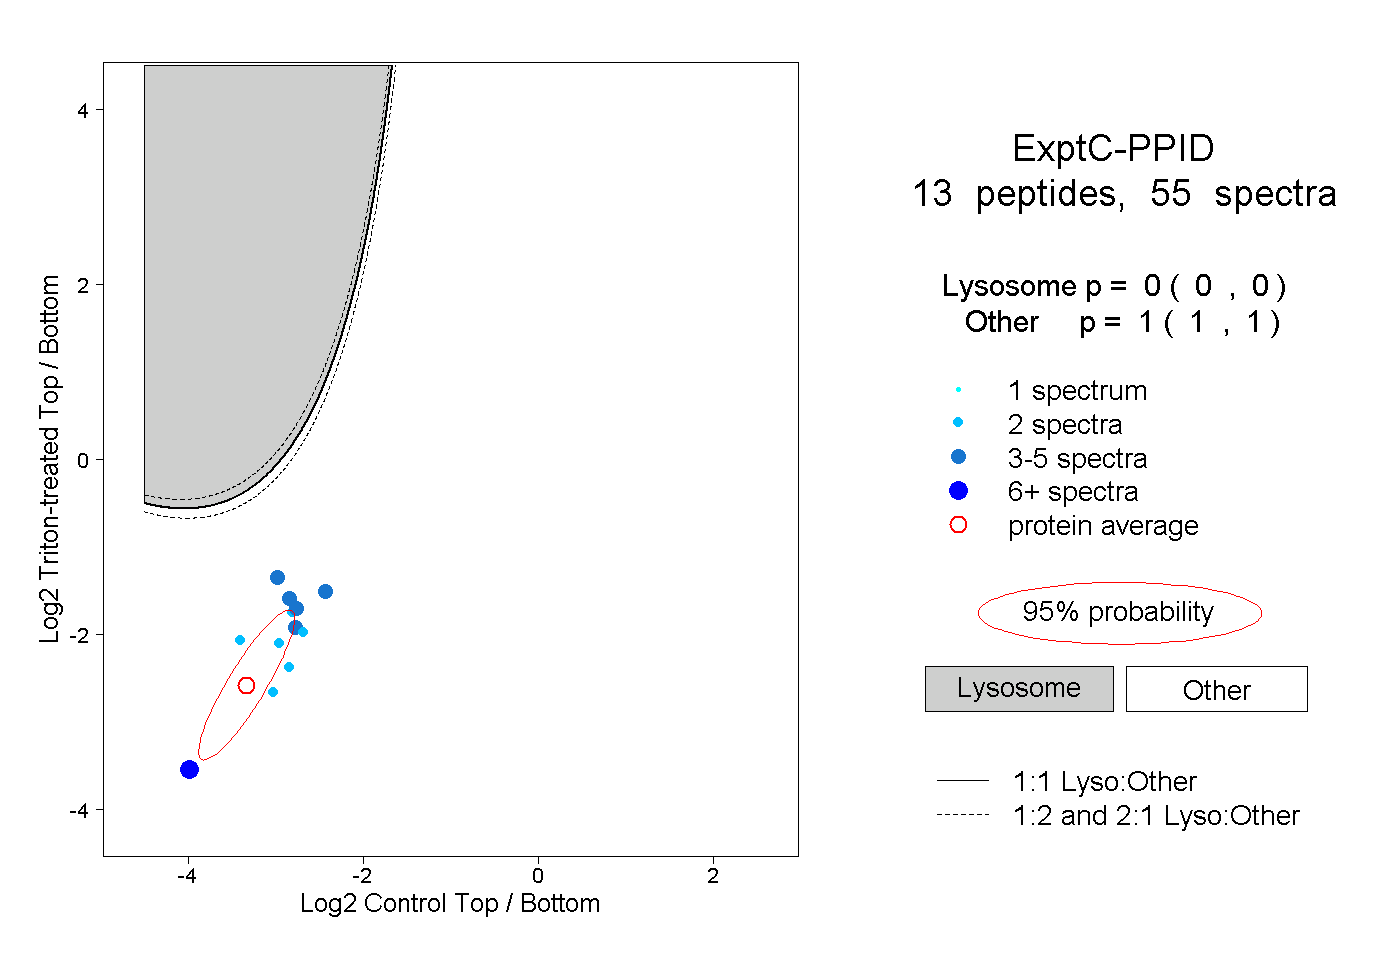 |
0.000 0.000 | 0.000 |
1.000 1.000 | 1.000 |
||||||||
| Plot | Lyso | Other | |||||||||||
| Expt D |
1 peptide |
2 spectra |
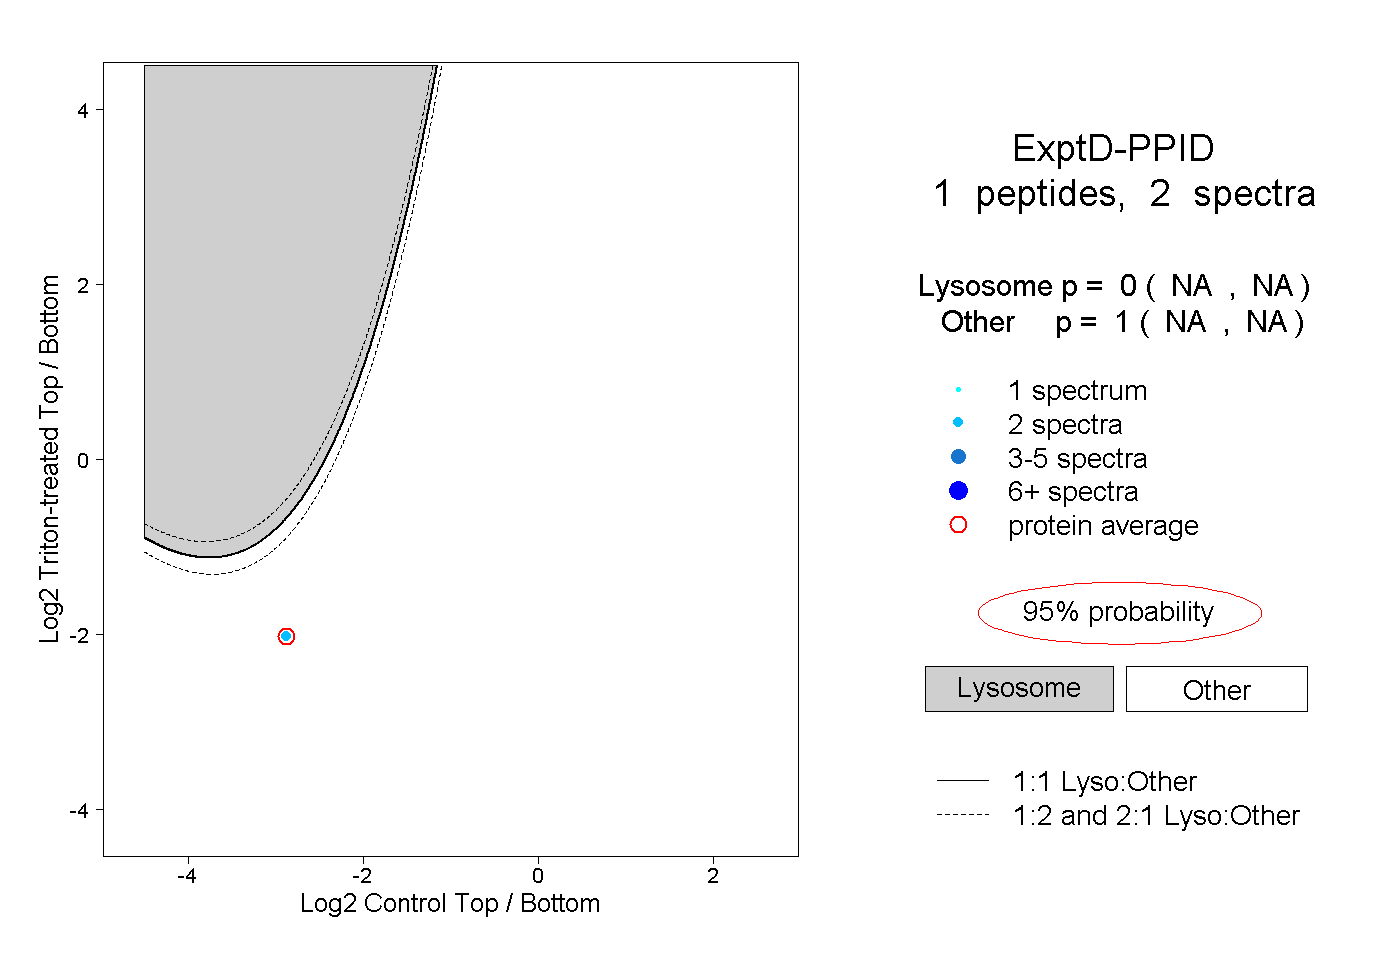 |
0.000 NA | NA |
1.000 NA | NA |