 2
2peptides
spectra
NA | NA
NA | NA
NA | NA
NA | NA
NA | NA
NA | NA
NA | NA
NA | NA
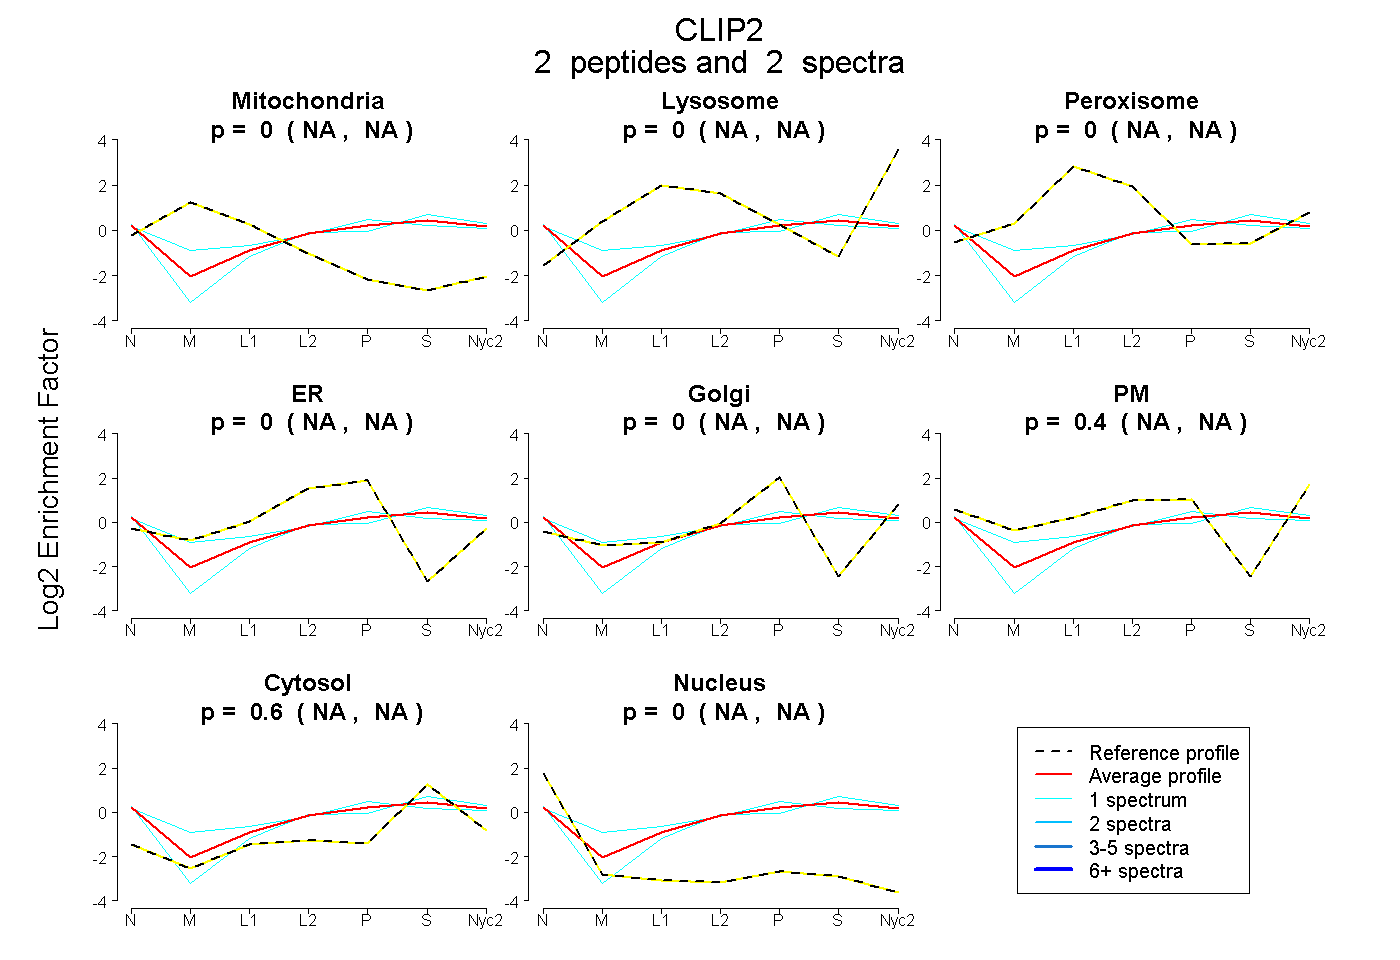
| Plot | Mito | Lyso | Perox | ER | Golgi | PM | Cytosol | Nucleus | |||||
| Expt A |
2 peptides |
2 spectra |
|
0.000 NA | NA |
0.000 NA | NA |
0.000 NA | NA |
0.000 NA | NA |
0.000 NA | NA |
0.404 NA | NA |
0.596 NA | NA |
0.000 NA | NA |
| 1 spectrum, FGLFAPIHK | 0.000 | 0.000 | 0.040 | 0.028 | 0.058 | 0.392 | 0.482 | 0.000 | ||
| 1 spectrum, IDSLLK | 0.000 | 0.000 | 0.000 | 0.000 | 0.000 | 0.311 | 0.689 | 0.000 |