 5
5peptides
spectra
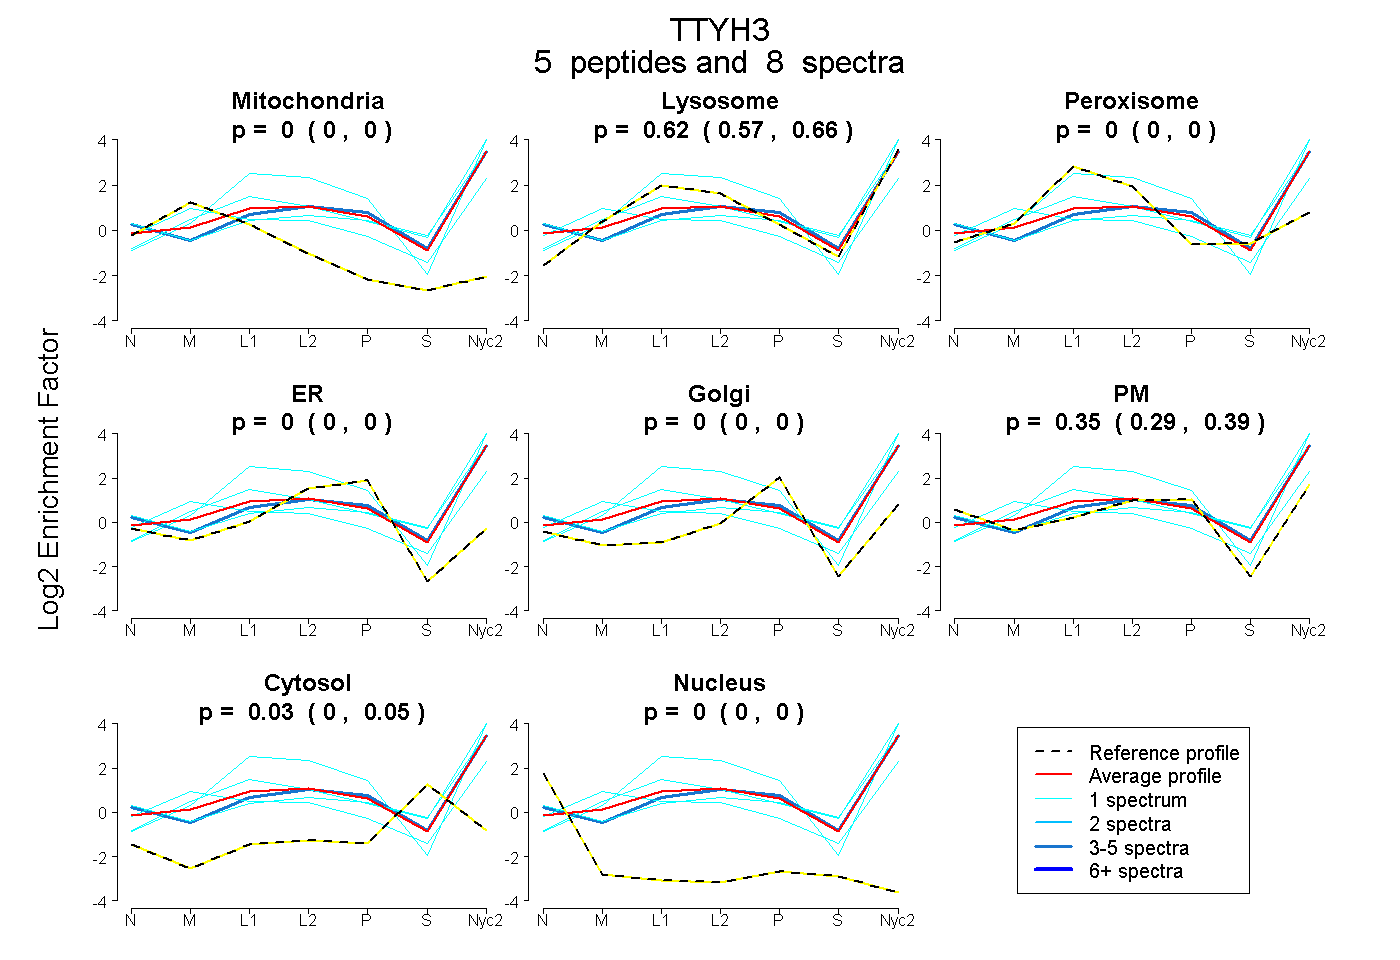
0.000 | 0.000
0.571 | 0.665
0.000 | 0.000
0.000 | 0.000
0.000 | 0.000
0.295 | 0.394
0.001 | 0.049
0.000 | 0.000
3peptides
spectra
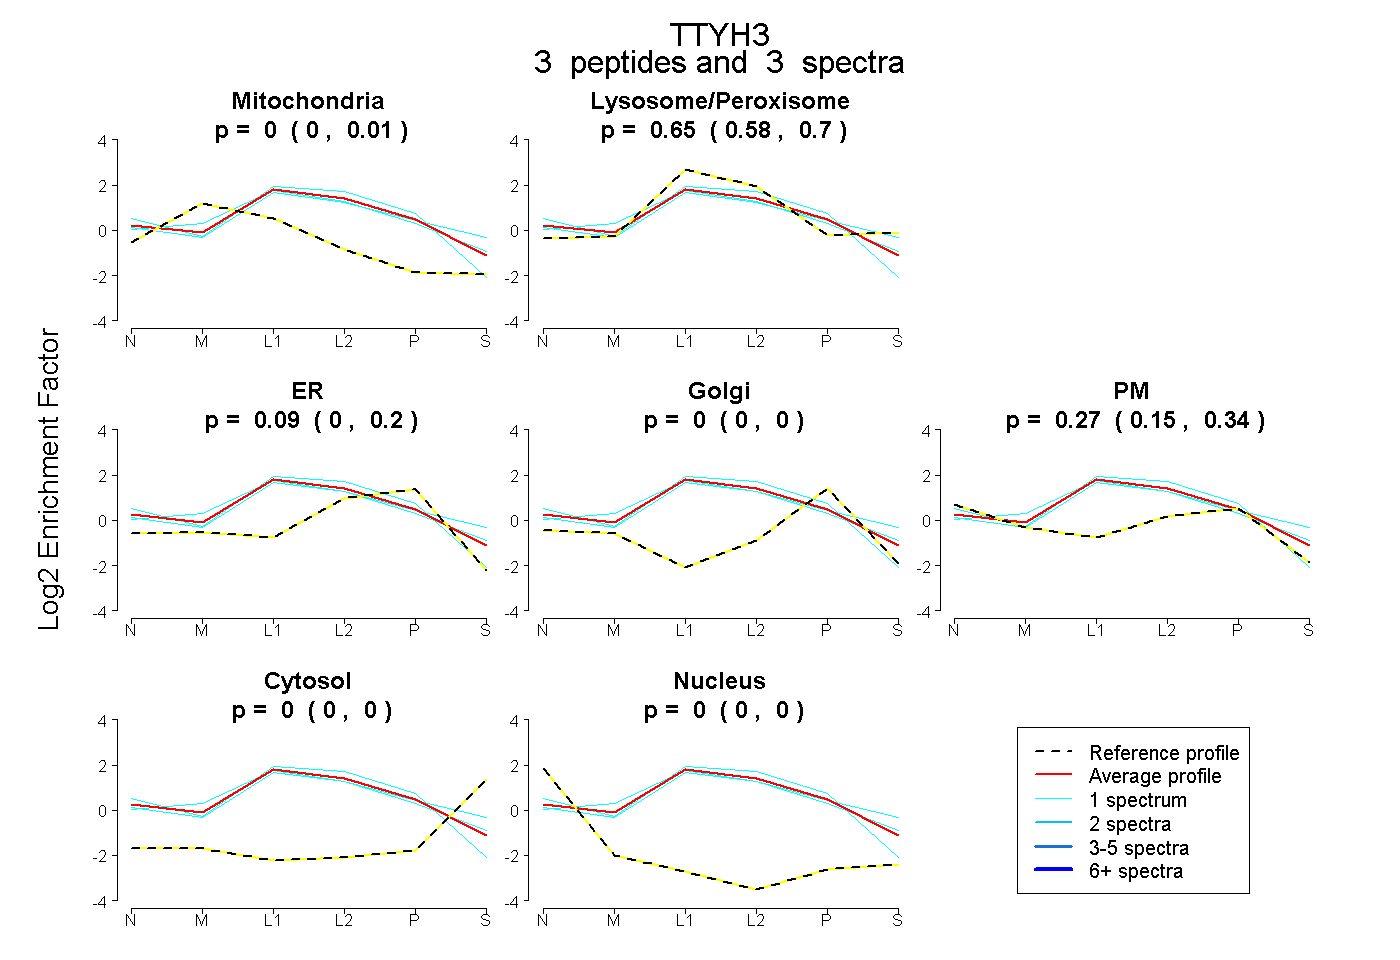
0.000 | 0.013
0.577 | 0.697
0.000 | 0.203
0.000 | 0.000
0.153 | 0.336
0.000 | 0.000
0.000 | 0.000
9peptides
spectra
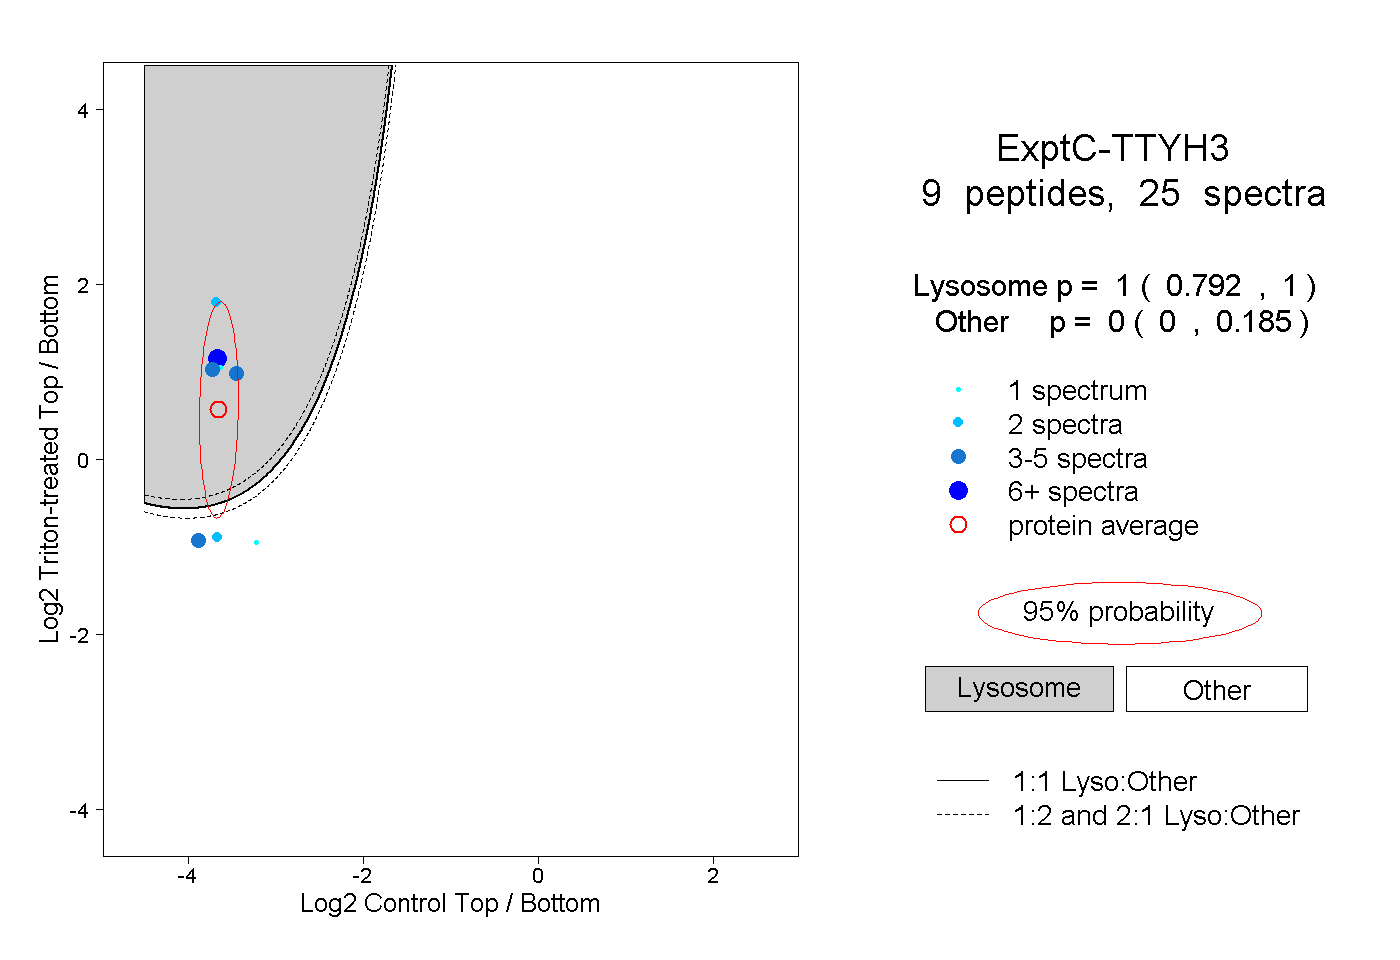
0.792 | 1.000
0.000 | 0.185
5peptides
spectra
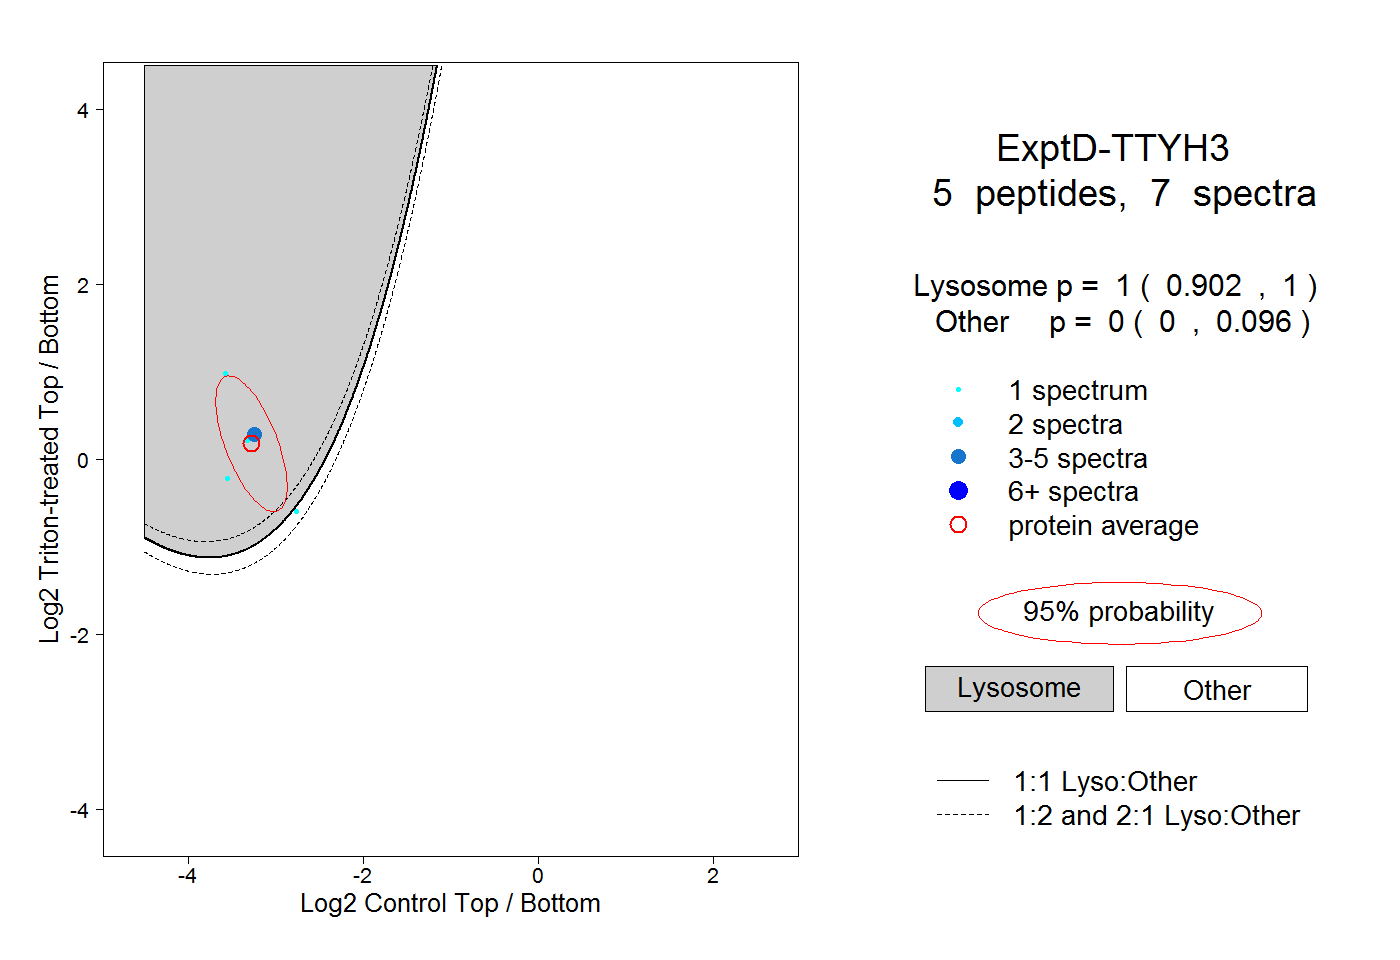
0.902 | 1.000
0.000 | 0.096