 14
14peptides
spectra
0.890 | 0.911
0.000 | 0.000
0.000 | 0.000
0.000 | 0.000
0.000 | 0.000
0.000 | 0.000
0.087 | 0.108
0.000 | 0.000
| Plot | Mito | Lyso | Perox | ER | Golgi | PM | Cytosol | Nucleus | |||||
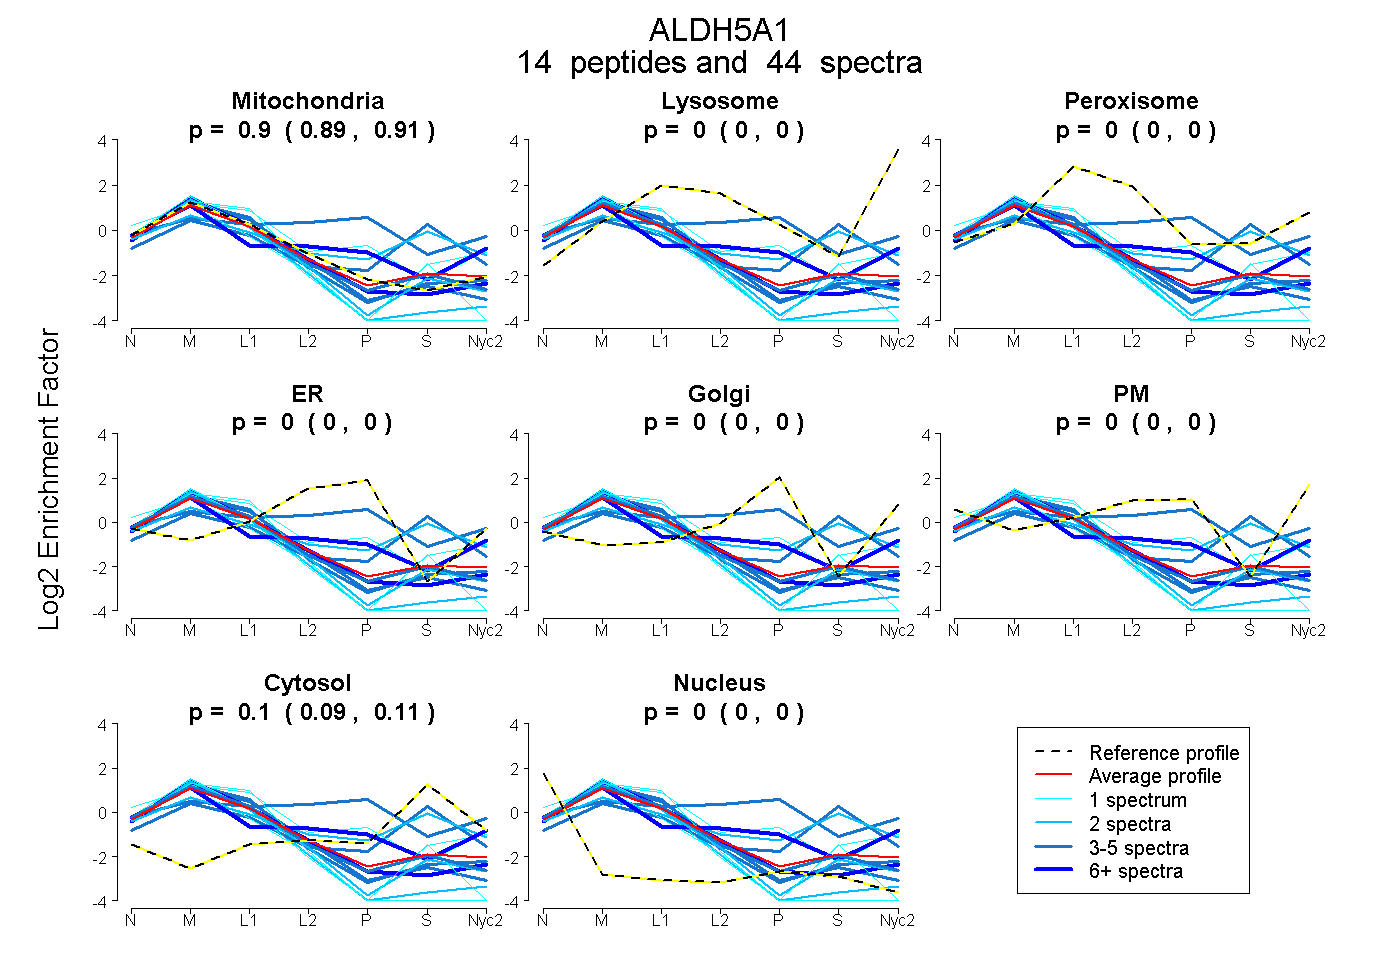
| Expt A |
14 peptides |
44 spectra |
|
0.901 0.890 | 0.911 |
0.000 0.000 | 0.000 |
0.000 0.000 | 0.000 |
0.000 0.000 | 0.000 |
0.000 0.000 | 0.000 |
0.000 0.000 | 0.000 |
0.099 0.087 | 0.108 |
0.000 0.000 | 0.000 |
| 2 spectra, LGTVADCGVPEAR | 0.477 | 0.000 | 0.155 | 0.000 | 0.000 | 0.000 | 0.368 | 0.000 | ||
| 6 spectra, NAGQTCVCSNR | 0.669 | 0.017 | 0.000 | 0.000 | 0.233 | 0.044 | 0.036 | 0.000 | ||
| 5 spectra, EVGEVLCTDPLVSK | 0.943 | 0.000 | 0.000 | 0.000 | 0.000 | 0.000 | 0.000 | 0.057 | ||
| 1 spectrum, IITAESGKPLK | 0.818 | 0.000 | 0.000 | 0.000 | 0.000 | 0.000 | 0.131 | 0.051 | ||
| 3 spectra, AAYDAFSSWK | 0.976 | 0.000 | 0.000 | 0.000 | 0.000 | 0.000 | 0.000 | 0.024 | ||
| 2 spectra, QSGLGR | 0.935 | 0.000 | 0.000 | 0.000 | 0.000 | 0.000 | 0.000 | 0.065 | ||
| 1 spectrum, GIHDSFVTK | 0.681 | 0.105 | 0.063 | 0.000 | 0.151 | 0.000 | 0.000 | 0.000 | ||
| 5 spectra, GDSFVGGR | 0.510 | 0.000 | 0.023 | 0.000 | 0.000 | 0.000 | 0.468 | 0.000 | ||
| 1 spectrum, WLPTPATFPVYDPASGAK | 0.938 | 0.000 | 0.000 | 0.000 | 0.000 | 0.000 | 0.000 | 0.062 | ||
| 1 spectrum, ISFTGSTATGK | 0.849 | 0.000 | 0.000 | 0.000 | 0.000 | 0.000 | 0.000 | 0.151 | ||
| 6 spectra, ILLHHAANSVK | 0.986 | 0.000 | 0.000 | 0.000 | 0.000 | 0.000 | 0.000 | 0.014 | ||
| 5 spectra, YGIDEYLEVK | 0.922 | 0.000 | 0.000 | 0.000 | 0.000 | 0.000 | 0.033 | 0.045 | ||
| 2 spectra, GATVVTGGK | 0.888 | 0.000 | 0.000 | 0.000 | 0.000 | 0.000 | 0.000 | 0.112 | ||
| 4 spectra, HQSGGNFFEPTLLSNVTR | 0.227 | 0.000 | 0.286 | 0.083 | 0.345 | 0.000 | 0.059 | 0.000 |
| Plot | Mito | Lyso or Perox | ER | Golgi | PM | Cytosol | Nucleus | ||||||
| Expt B |
11 peptides |
35 spectra |
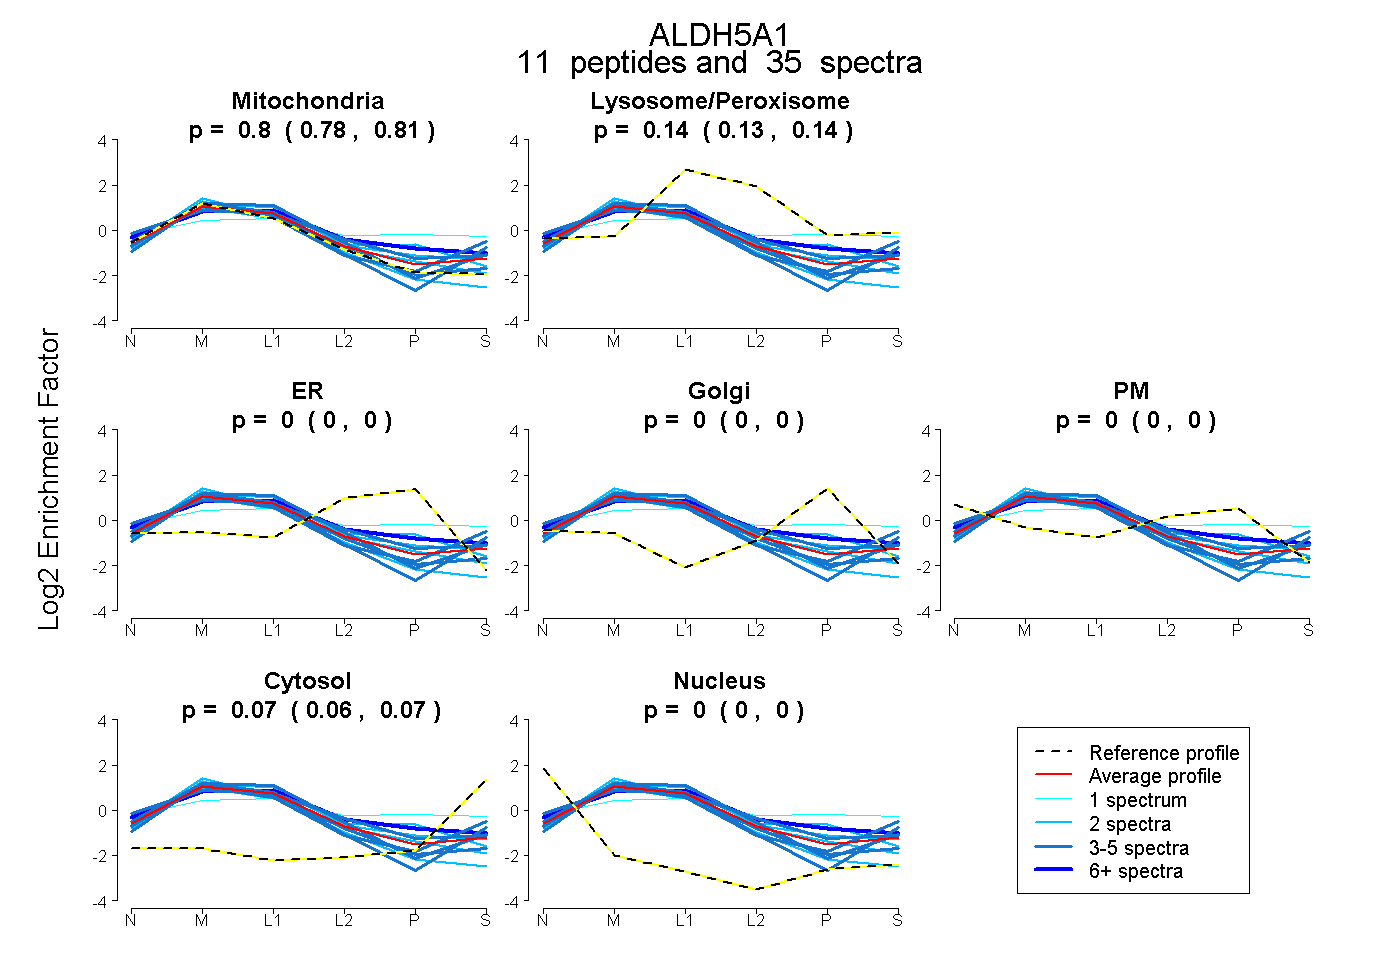 |
0.796 0.783 | 0.808 |
0.138 0.128 | 0.145 |
0.000 0.000 | 0.000 |
0.000 0.000 | 0.000 |
0.000 0.000 | 0.000 |
0.067 0.059 | 0.073 |
0.000 0.000 | 0.000 |
|||
| Plot | Lyso | Other | |||||||||||
| Expt C |
17 peptides |
295 spectra |
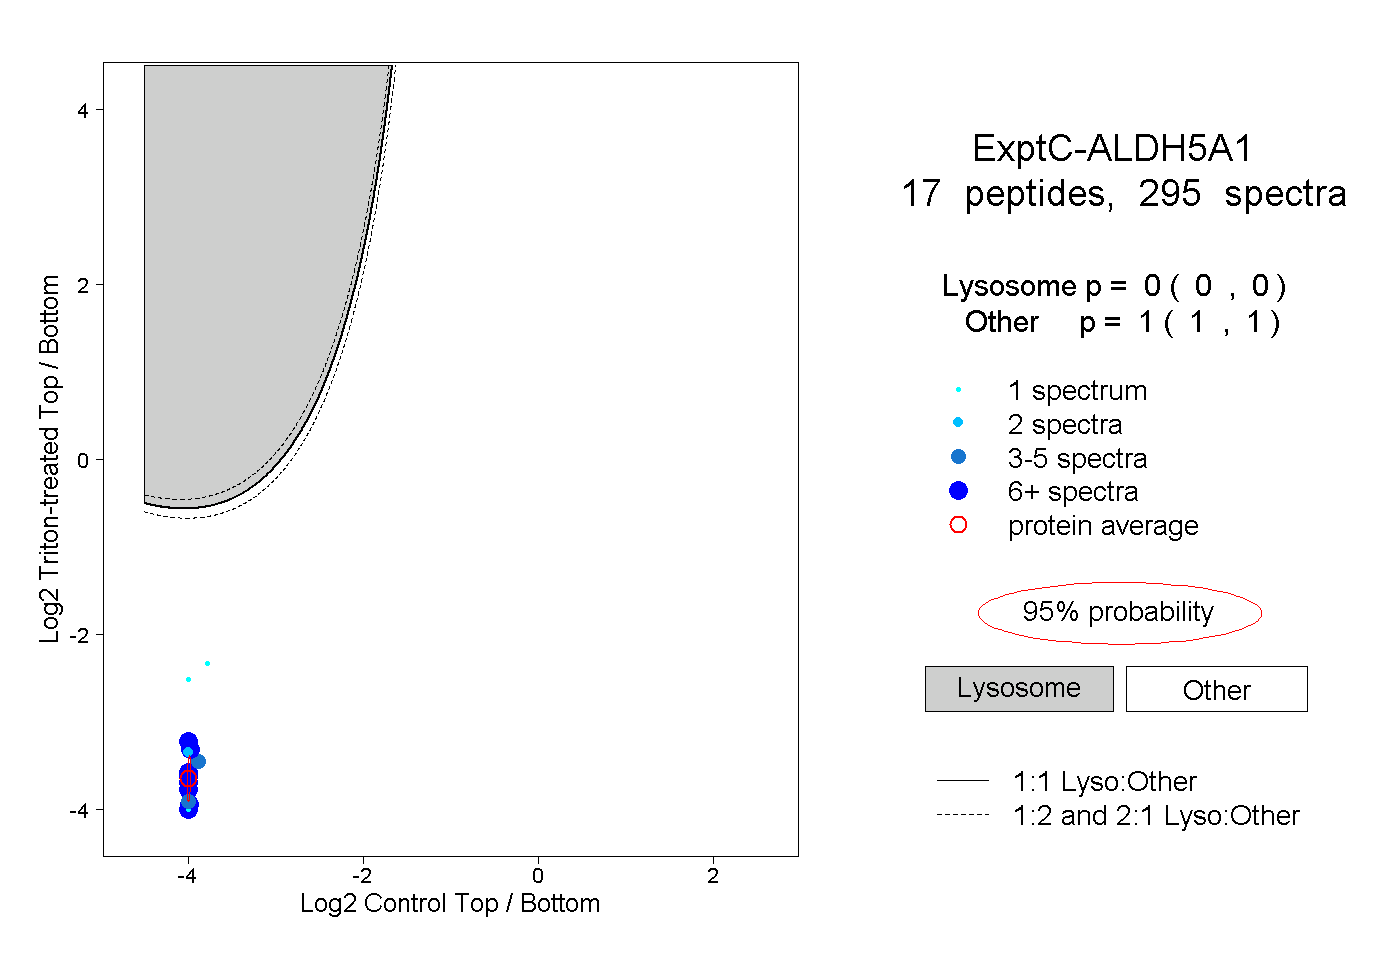 |
0.000 0.000 | 0.000 |
1.000 1.000 | 1.000 |
||||||||
| Plot | Lyso | Other | |||||||||||
| Expt D |
9 peptides |
20 spectra |
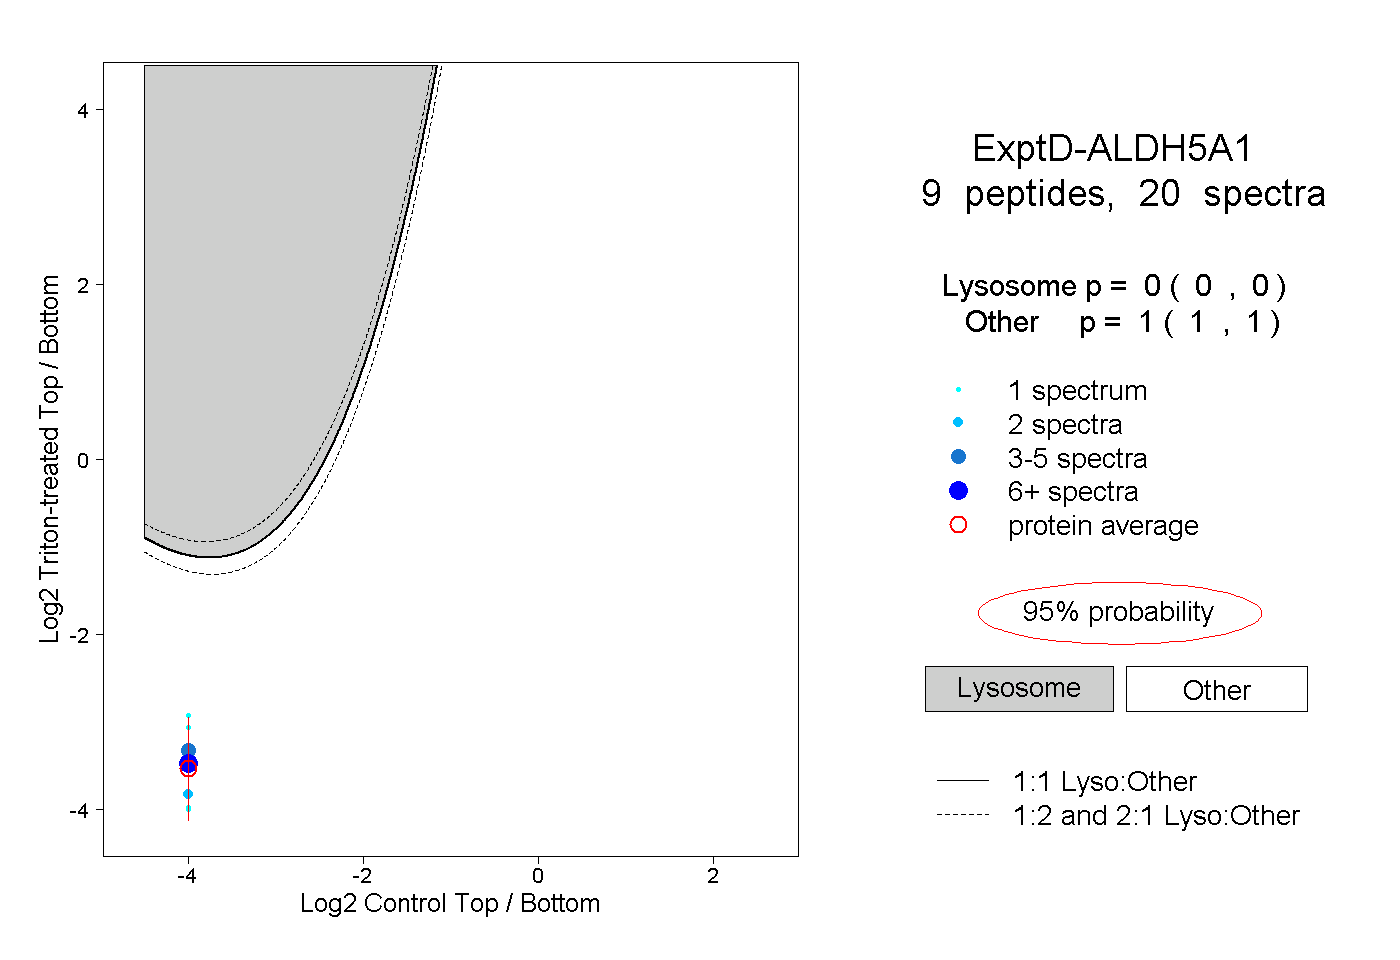 |
0.000 0.000 | 0.000 |
1.000 1.000 | 1.000 |