 14
14peptides
spectra
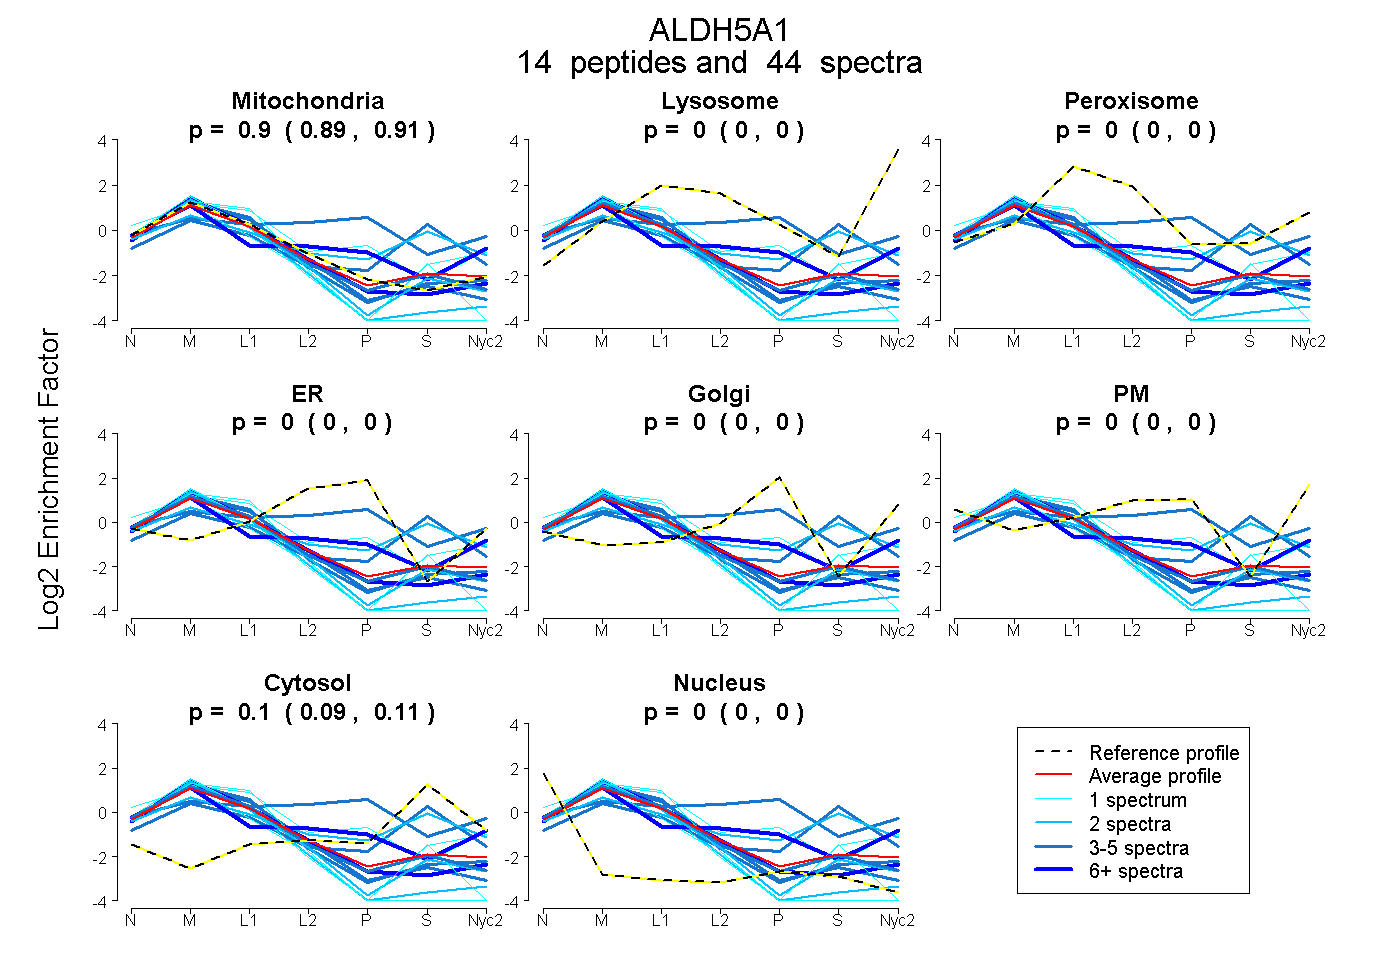
0.890 | 0.911
0.000 | 0.000
0.000 | 0.000
0.000 | 0.000
0.000 | 0.000
0.000 | 0.000
0.087 | 0.108
0.000 | 0.000
11peptides
spectra
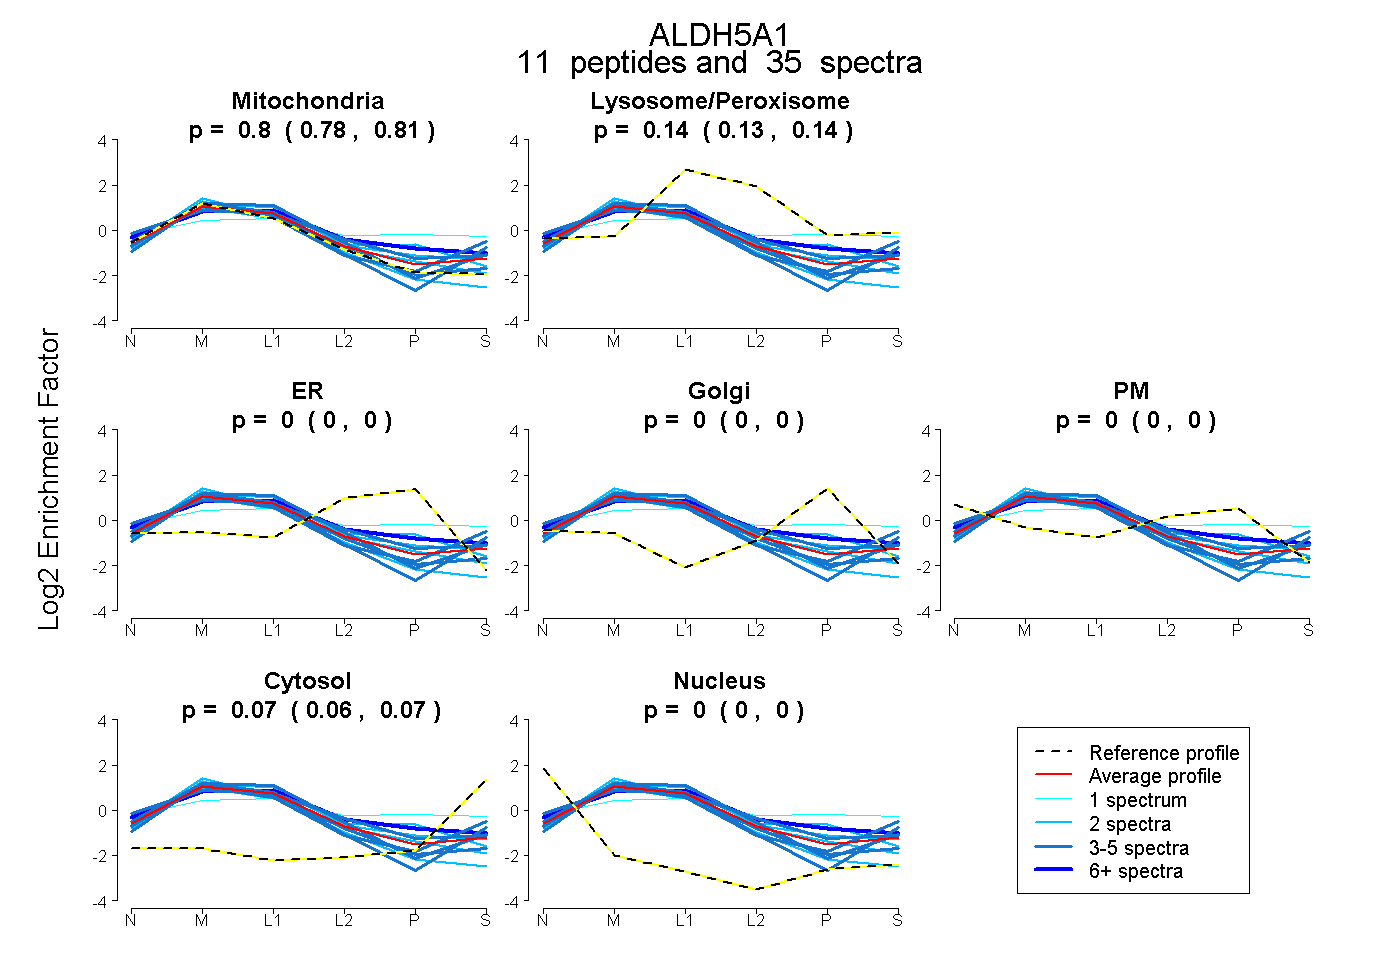
0.783 | 0.808
0.128 | 0.145
0.000 | 0.000
0.000 | 0.000
0.000 | 0.000
0.059 | 0.073
0.000 | 0.000
17peptides
spectra
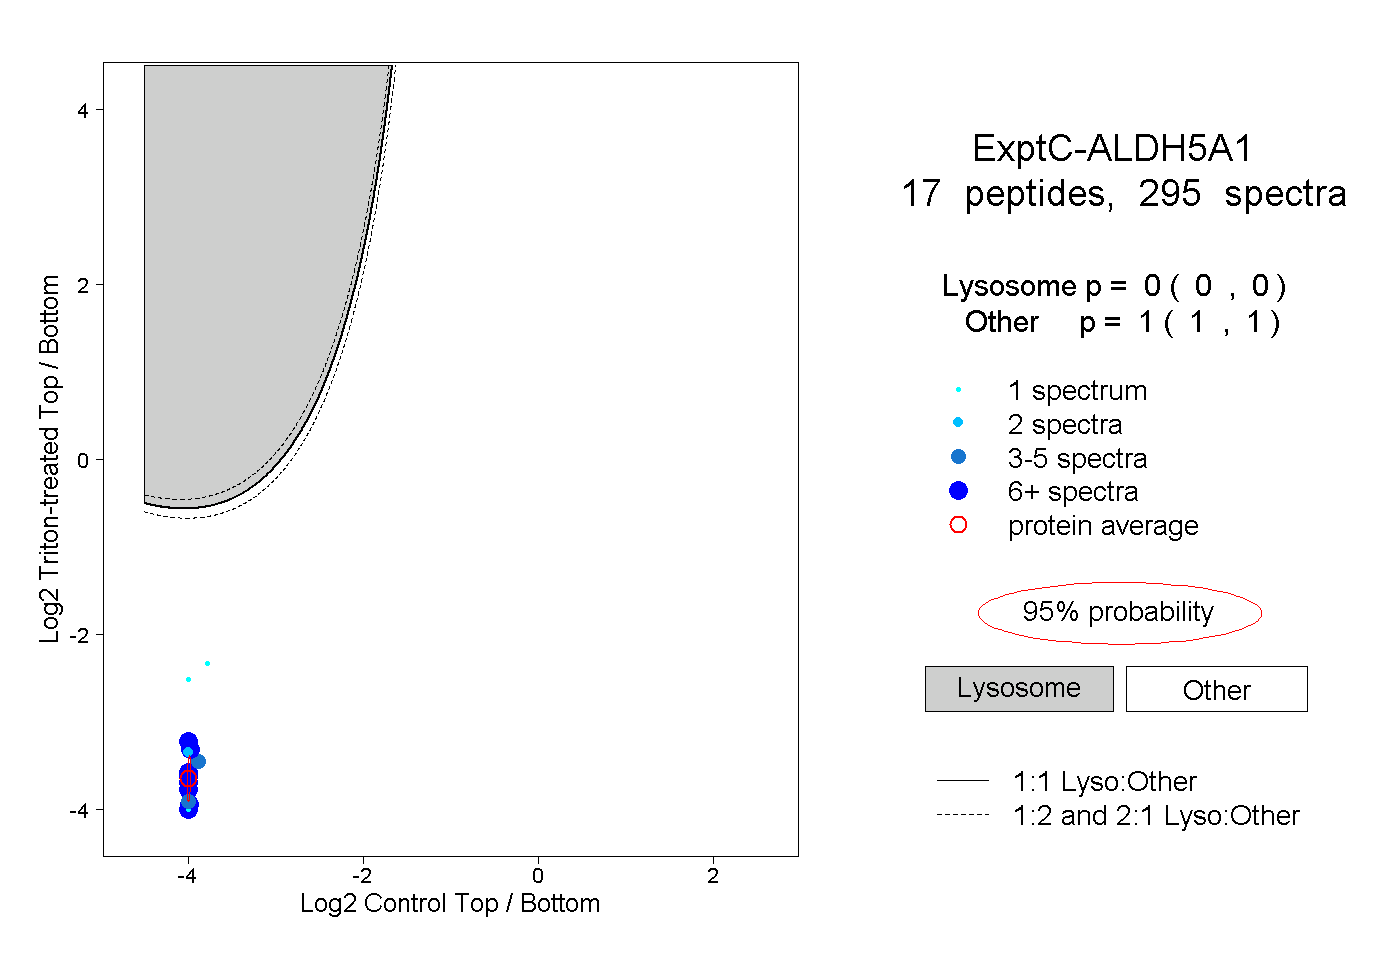
0.000 | 0.000
1.000 | 1.000
9peptides
spectra
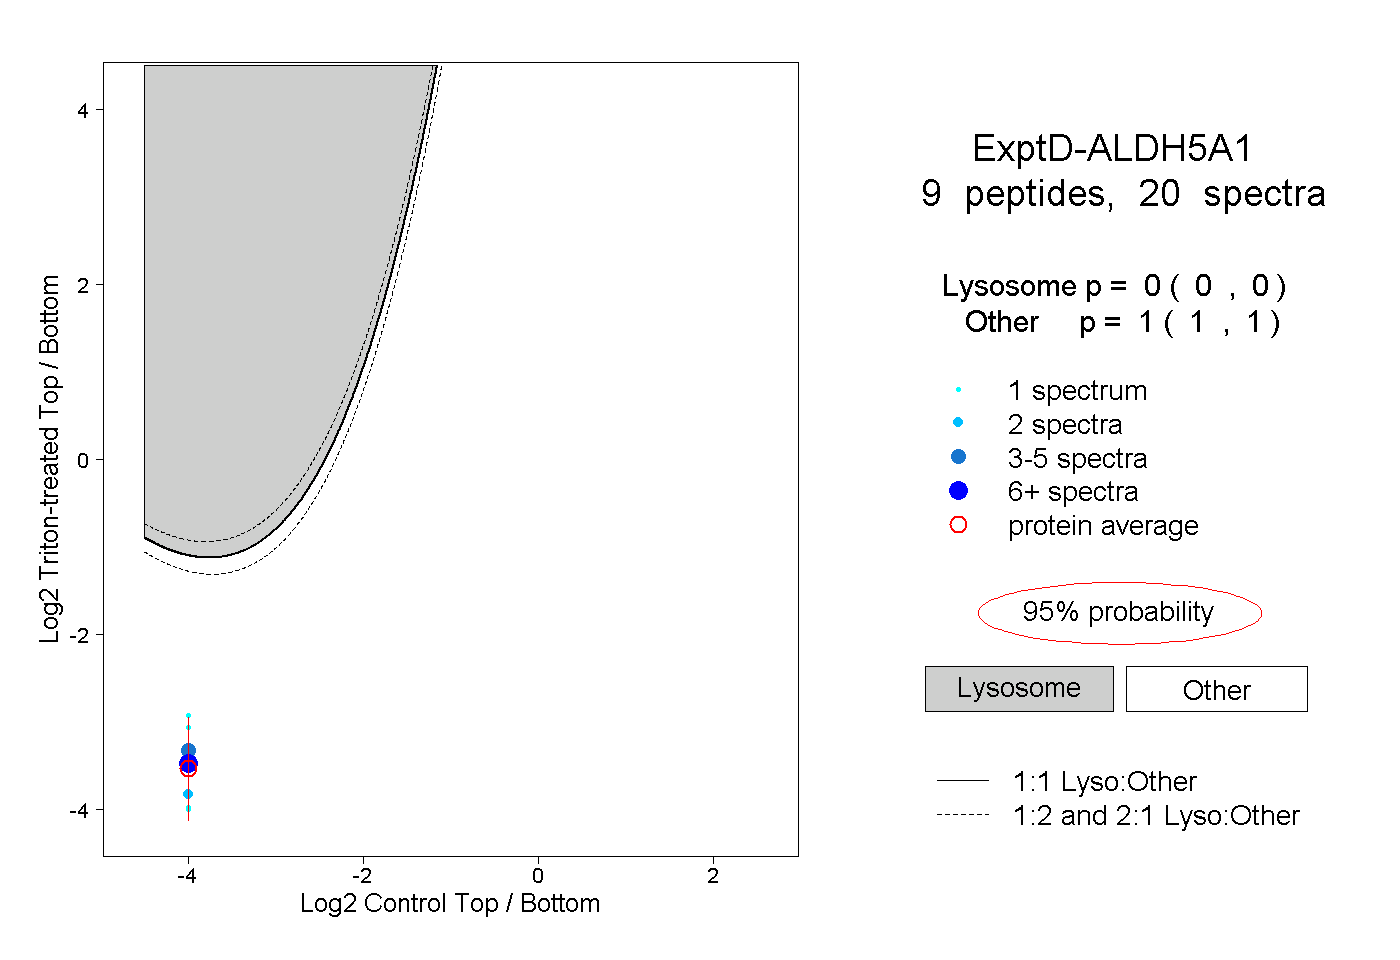
0.000 | 0.000
1.000 | 1.000