 5
5peptides
spectra
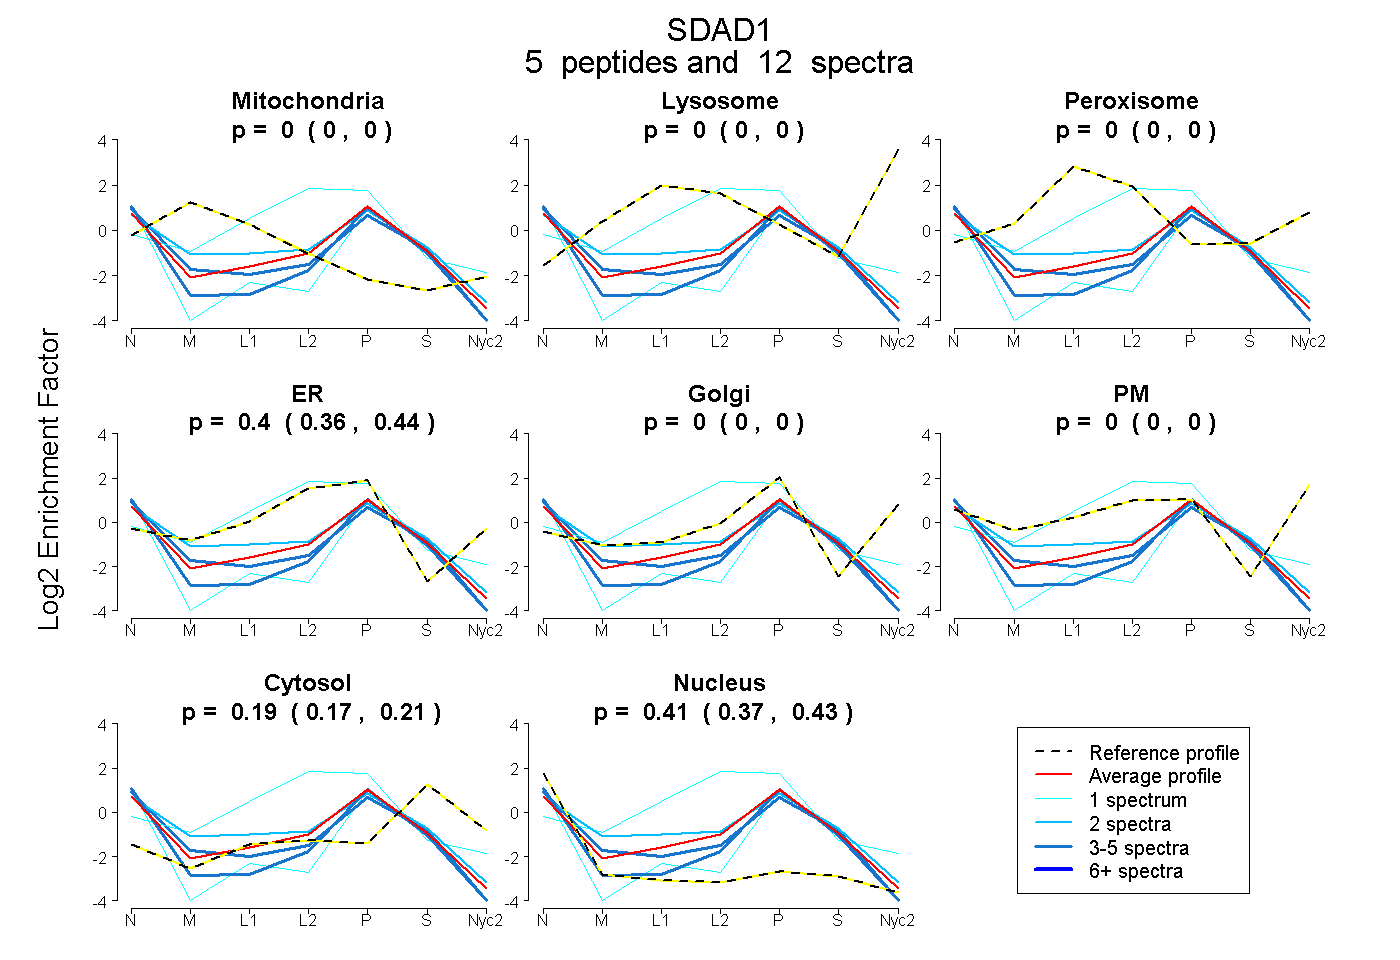
0.000 | 0.000
0.000 | 0.000
0.000 | 0.000
0.363 | 0.436
0.000 | 0.000
0.000 | 0.000
0.170 | 0.209
0.371 | 0.432
2peptides
spectra
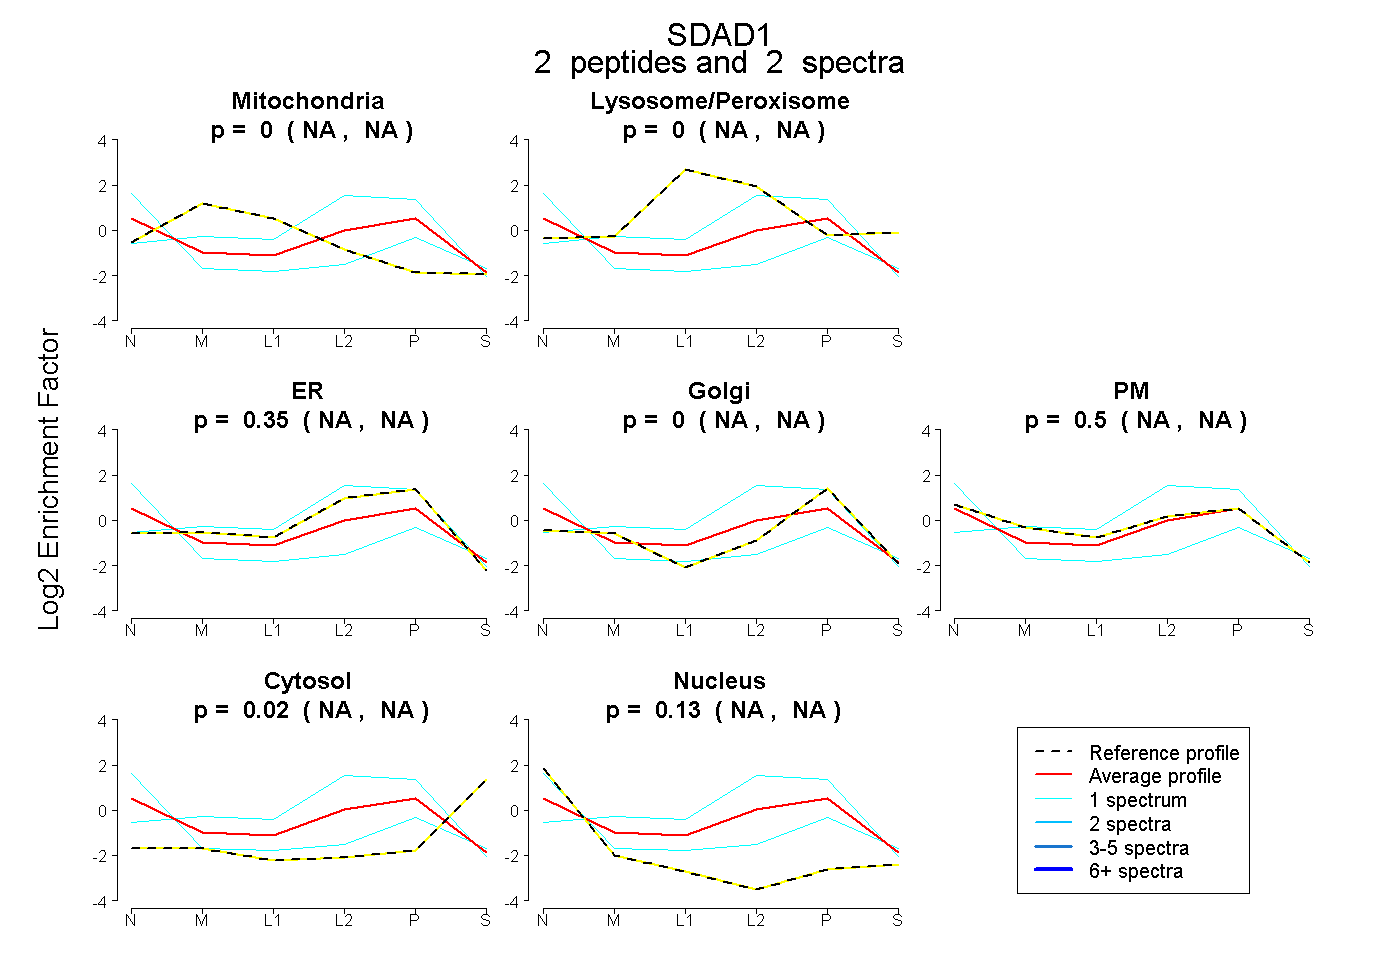
NA | NA
NA | NA
NA | NA
NA | NA
NA | NA
NA | NA
NA | NA
| Plot | Mito | Lyso | Perox | ER | Golgi | PM | Cytosol | Nucleus | |||||
| Expt A |
5 peptides |
12 spectra |
|
0.000 0.000 | 0.000 |
0.000 0.000 | 0.000 |
0.000 0.000 | 0.000 |
0.403 0.363 | 0.436 |
0.000 0.000 | 0.000 |
0.000 0.000 | 0.000 |
0.191 0.170 | 0.209 |
0.406 0.371 | 0.432 |
||
| Plot | Mito | Lyso or Perox | ER | Golgi | PM | Cytosol | Nucleus | ||||||
| Expt B |
2 peptides |
2 spectra |
|
0.000 NA | NA |
0.000 NA | NA |
0.349 NA | NA |
0.000 NA | NA |
0.501 NA | NA |
0.020 NA | NA |
0.130 NA | NA |