 5
5peptides
spectra
0.000 | 0.000
0.000 | 0.020
0.023 | 0.069
0.000 | 0.022
0.000 | 0.022
0.000 | 0.019
0.915 | 0.944
0.000 | 0.000
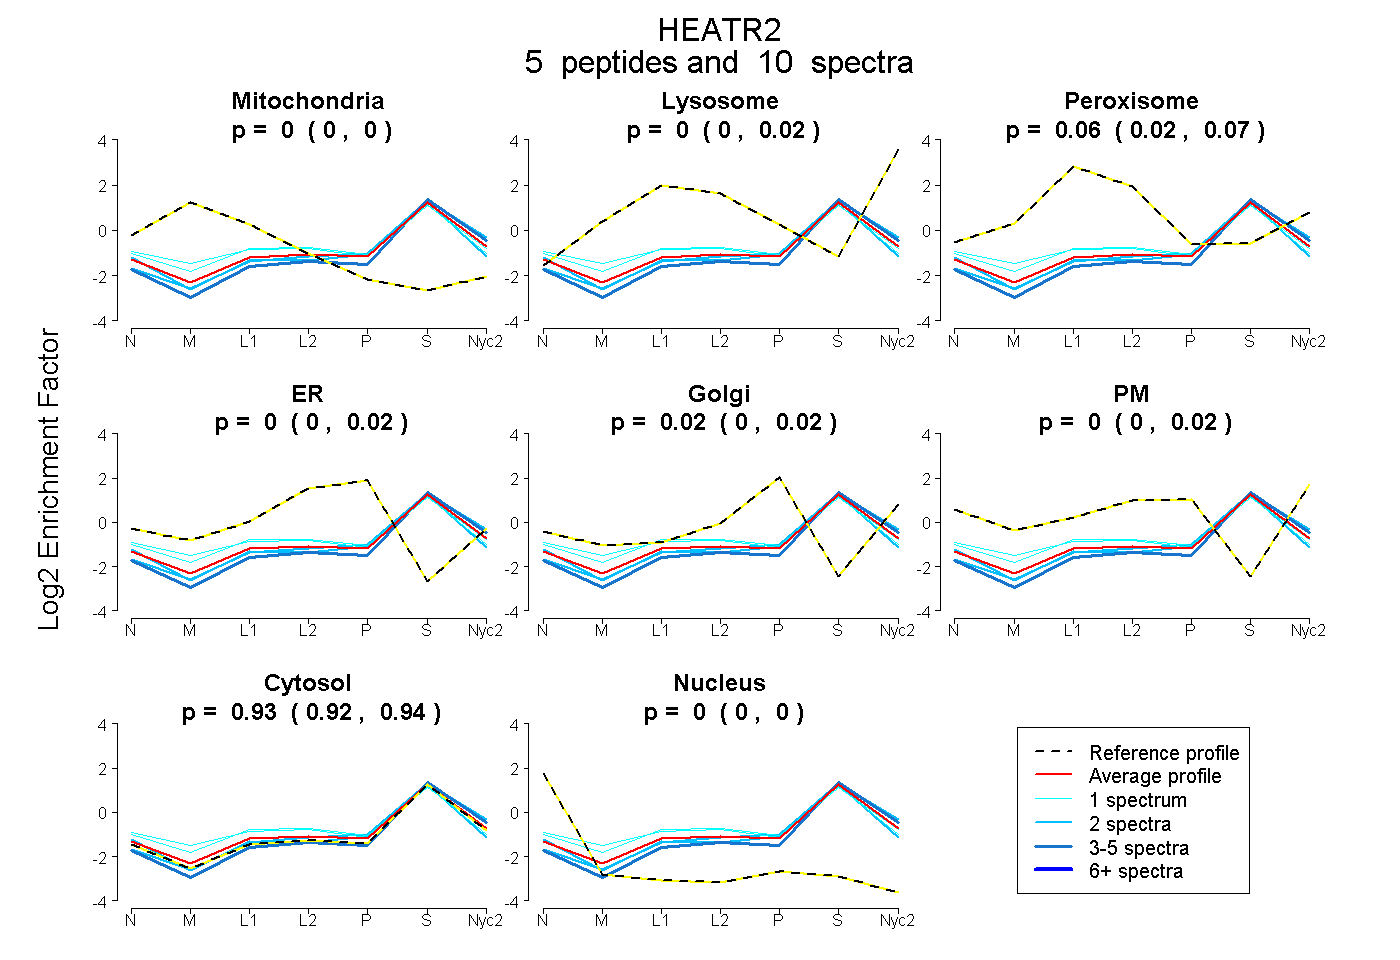
| Plot | Mito | Lyso | Perox | ER | Golgi | PM | Cytosol | Nucleus | |||||
| Expt A |
5 peptides |
10 spectra |
|
0.000 0.000 | 0.000 |
0.000 0.000 | 0.020 |
0.055 0.023 | 0.069 |
0.000 0.000 | 0.022 |
0.016 0.000 | 0.022 |
0.000 0.000 | 0.019 |
0.929 0.915 | 0.944 |
0.000 0.000 | 0.000 |
| 1 spectrum, TLHQACTDEEK | 0.070 | 0.000 | 0.144 | 0.000 | 0.000 | 0.000 | 0.786 | 0.000 | ||
| 1 spectrum, EGCECAAALAR | 0.034 | 0.000 | 0.129 | 0.016 | 0.000 | 0.000 | 0.821 | 0.000 | ||
| 2 spectra, ALAAHLLDLGLR | 0.000 | 0.058 | 0.000 | 0.000 | 0.000 | 0.000 | 0.942 | 0.000 | ||
| 4 spectra, LLPALTAR | 0.000 | 0.000 | 0.000 | 0.000 | 0.000 | 0.000 | 1.000 | 0.000 | ||
| 2 spectra, AVVSSCVR | 0.000 | 0.000 | 0.000 | 0.018 | 0.000 | 0.000 | 0.957 | 0.024 |
| Plot | Mito | Lyso or Perox | ER | Golgi | PM | Cytosol | Nucleus | ||||||
| Expt B |
1 peptide |
2 spectra |
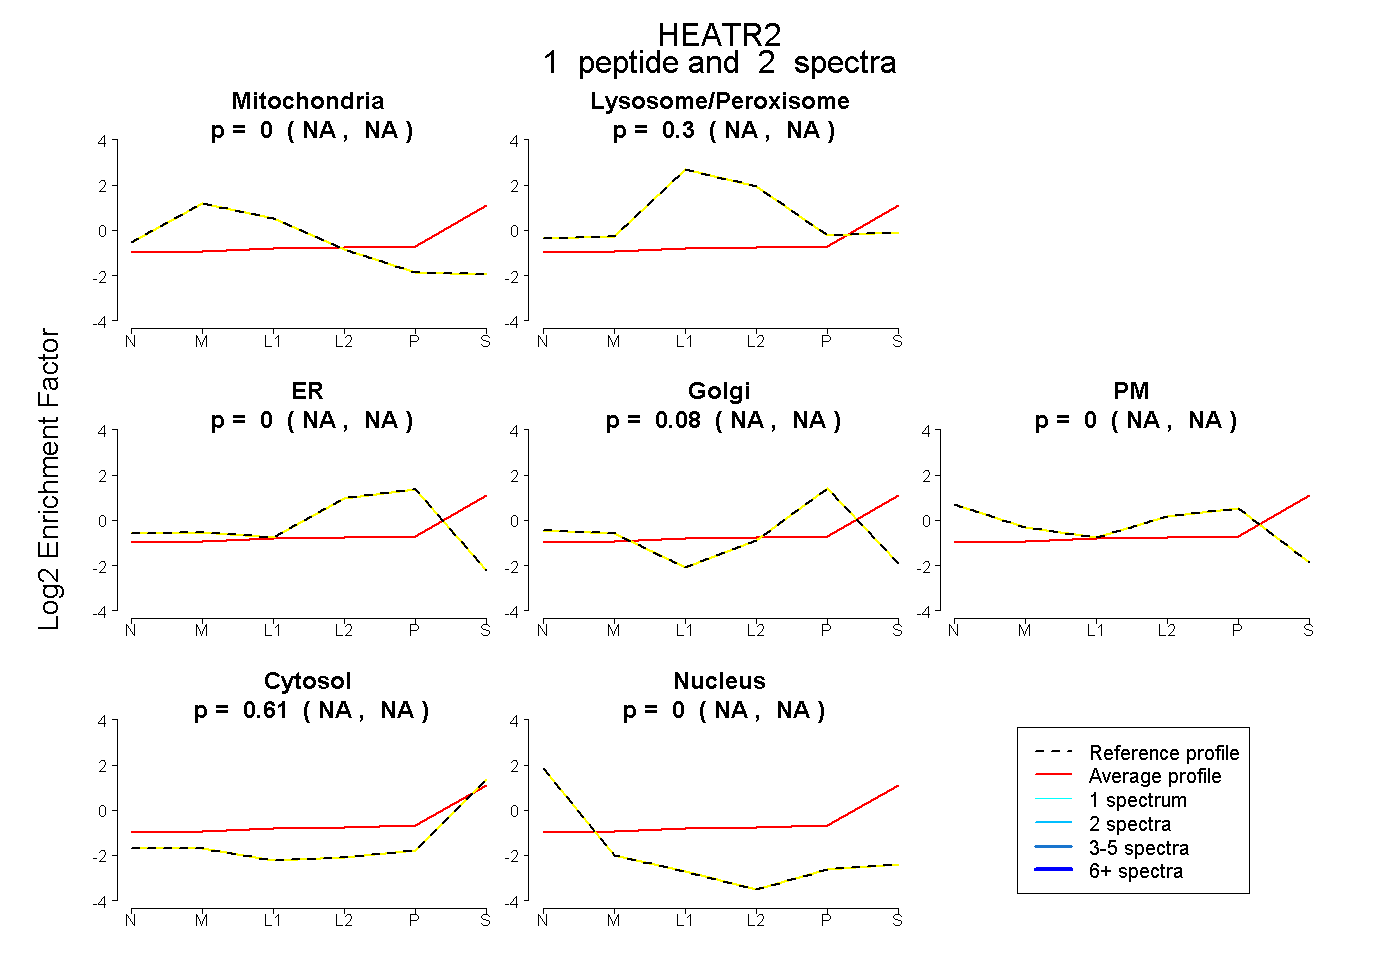 |
0.000 NA | NA |
0.305 NA | NA |
0.000 NA | NA |
0.085 NA | NA |
0.000 NA | NA |
0.611 NA | NA |
0.000 NA | NA |
|||
| Plot | Lyso | Other | |||||||||||
| Expt C |
2 peptides |
2 spectra |
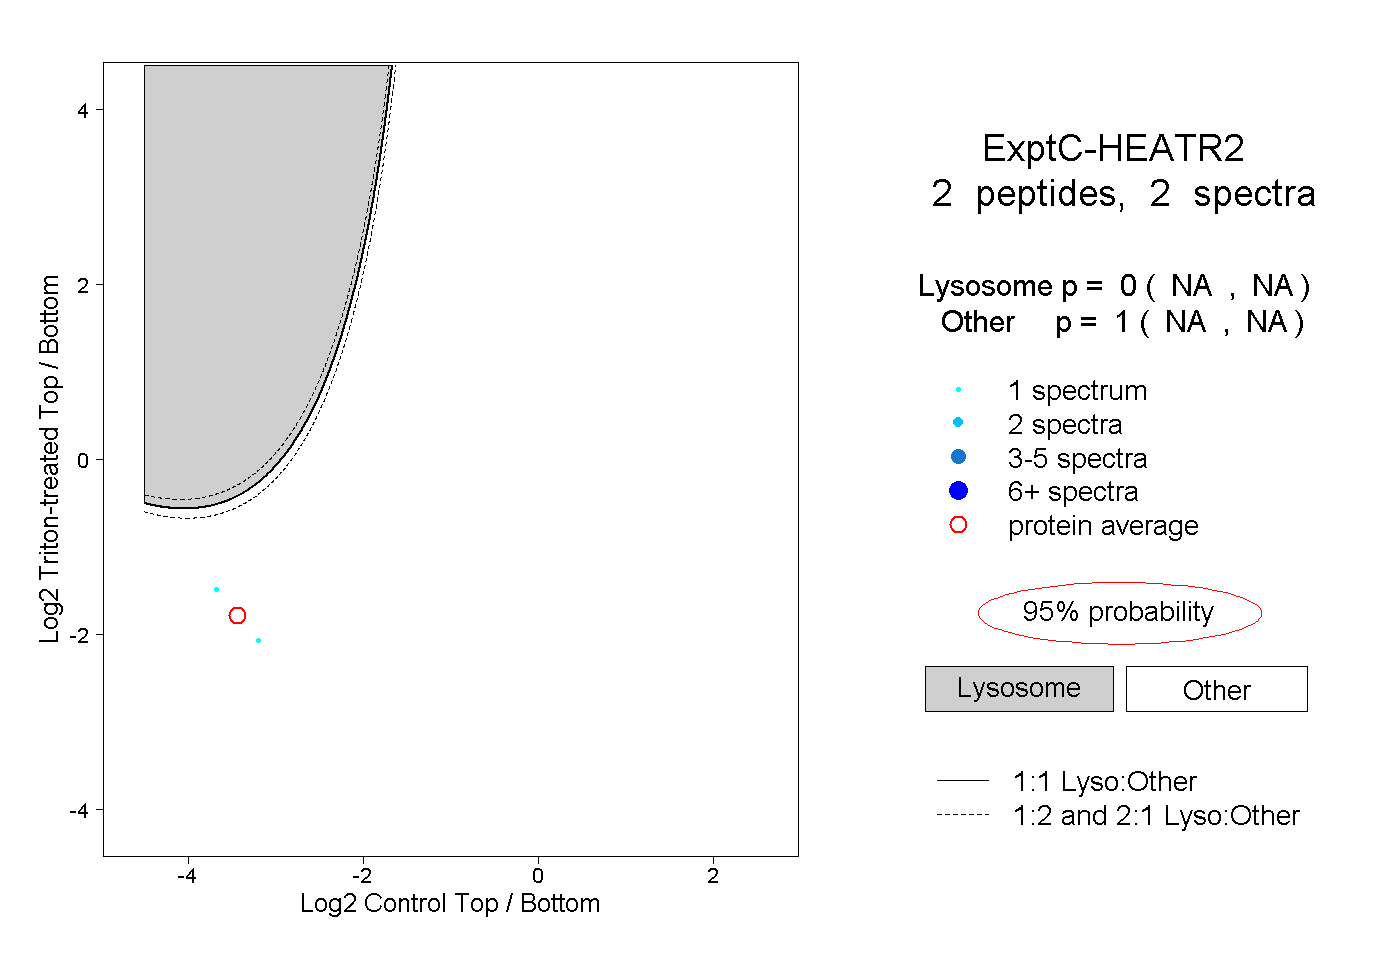 |
0.000 NA | NA |
1.000 NA | NA |