 1
1peptide
spectra
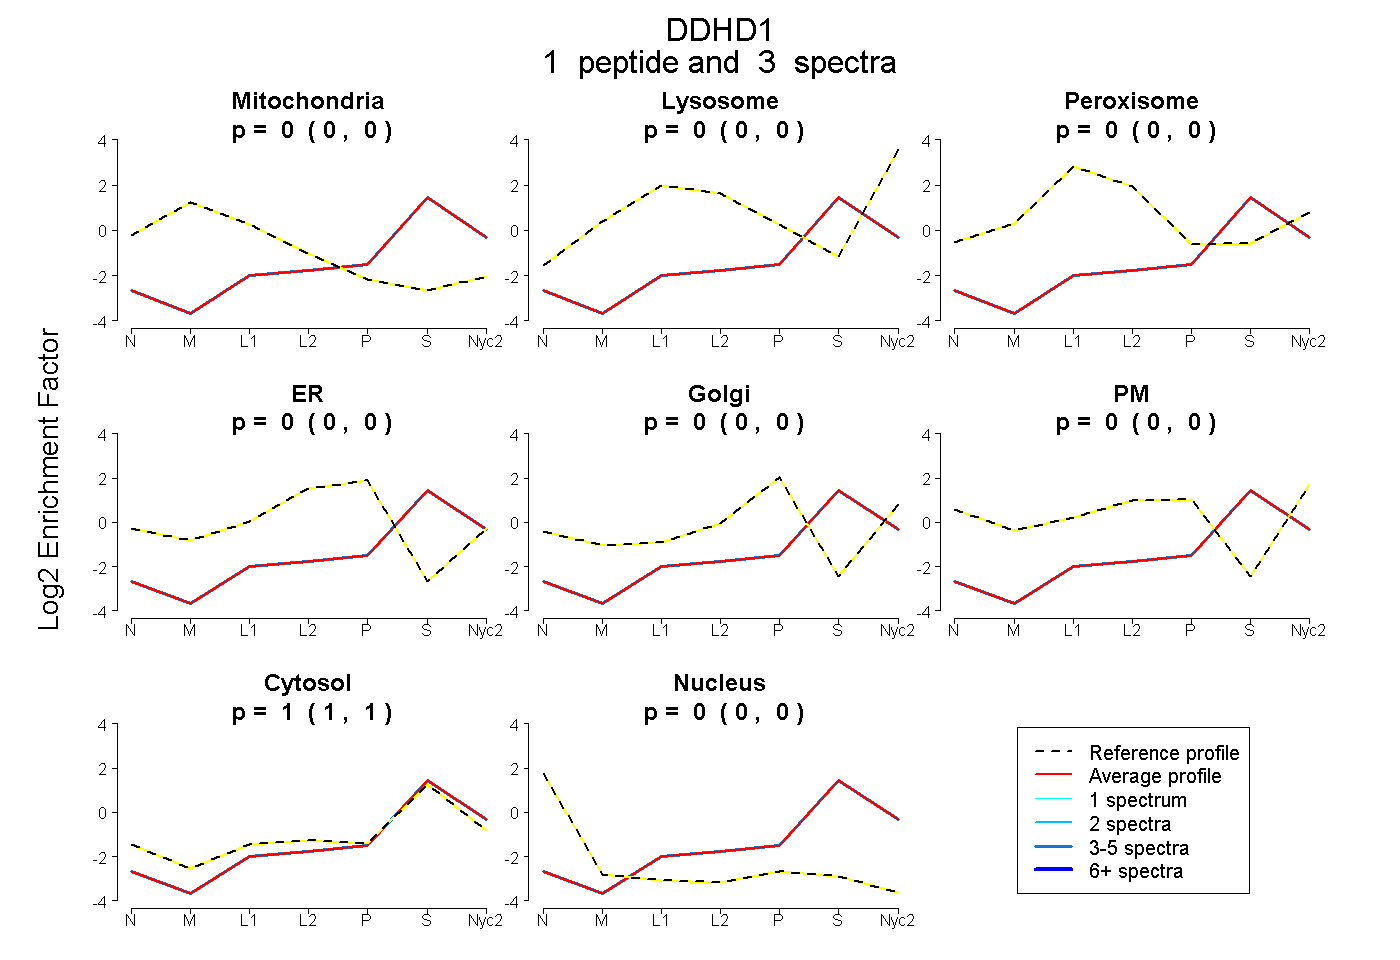
0.000 | 0.000
0.000 | 0.000
0.000 | 0.000
0.000 | 0.000
0.000 | 0.000
0.000 | 0.000
1.000 | 1.000
0.000 | 0.000
1peptide
spectra
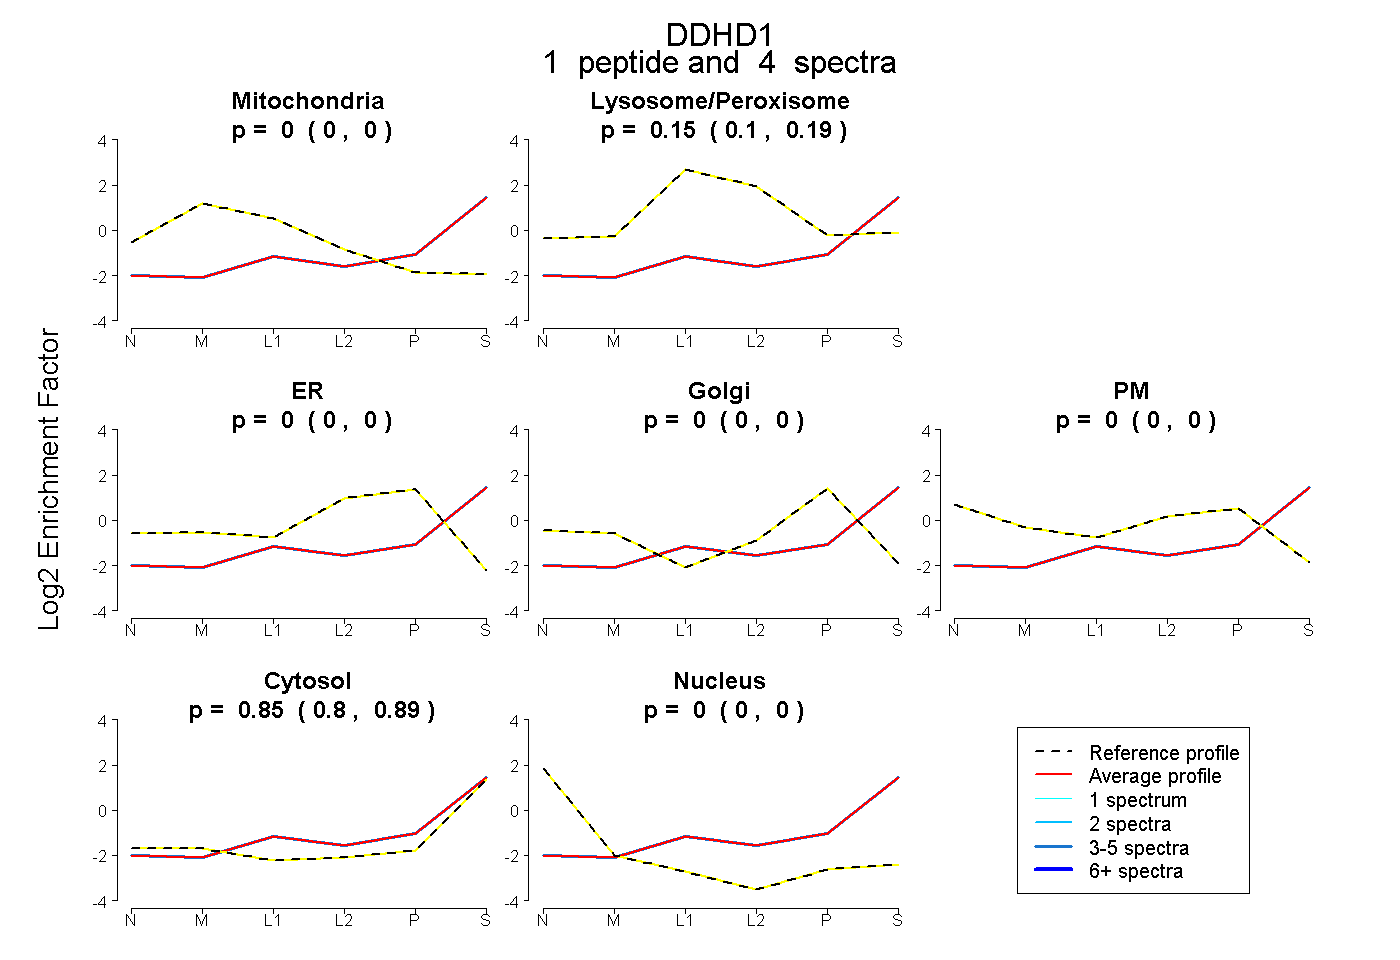
0.000 | 0.000
0.099 | 0.192
0.000 | 0.001
0.000 | 0.000
0.000 | 0.000
0.803 | 0.890
0.000 | 0.000