 1
1peptide
spectra
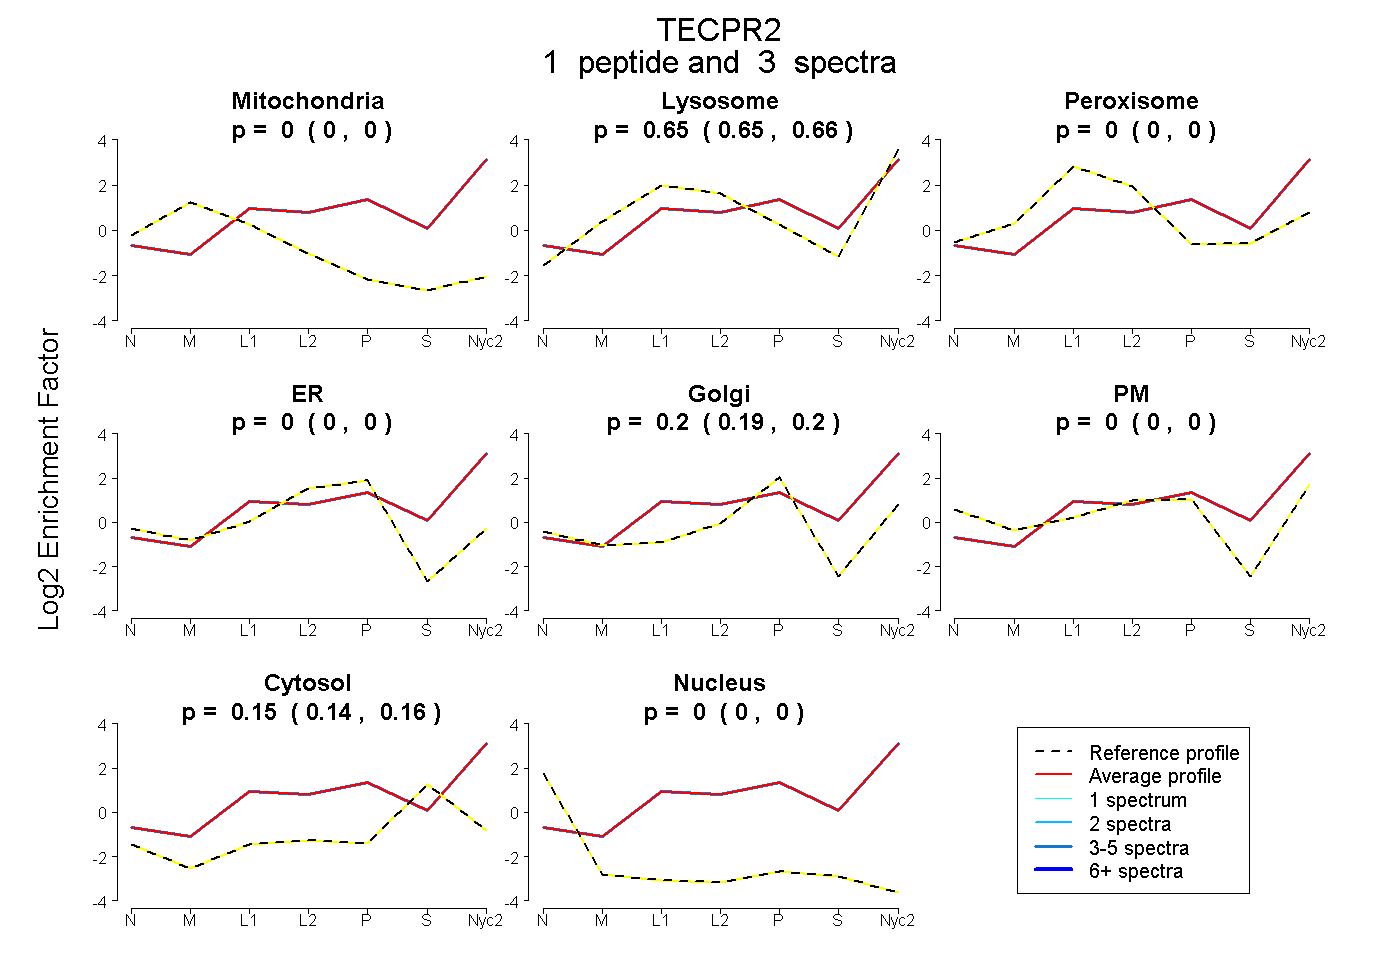
0.000 | 0.000
0.646 | 0.659
0.000 | 0.000
0.000 | 0.000
0.187 | 0.205
0.000 | 0.000
0.143 | 0.156
0.000 | 0.000
1peptide
spectrum
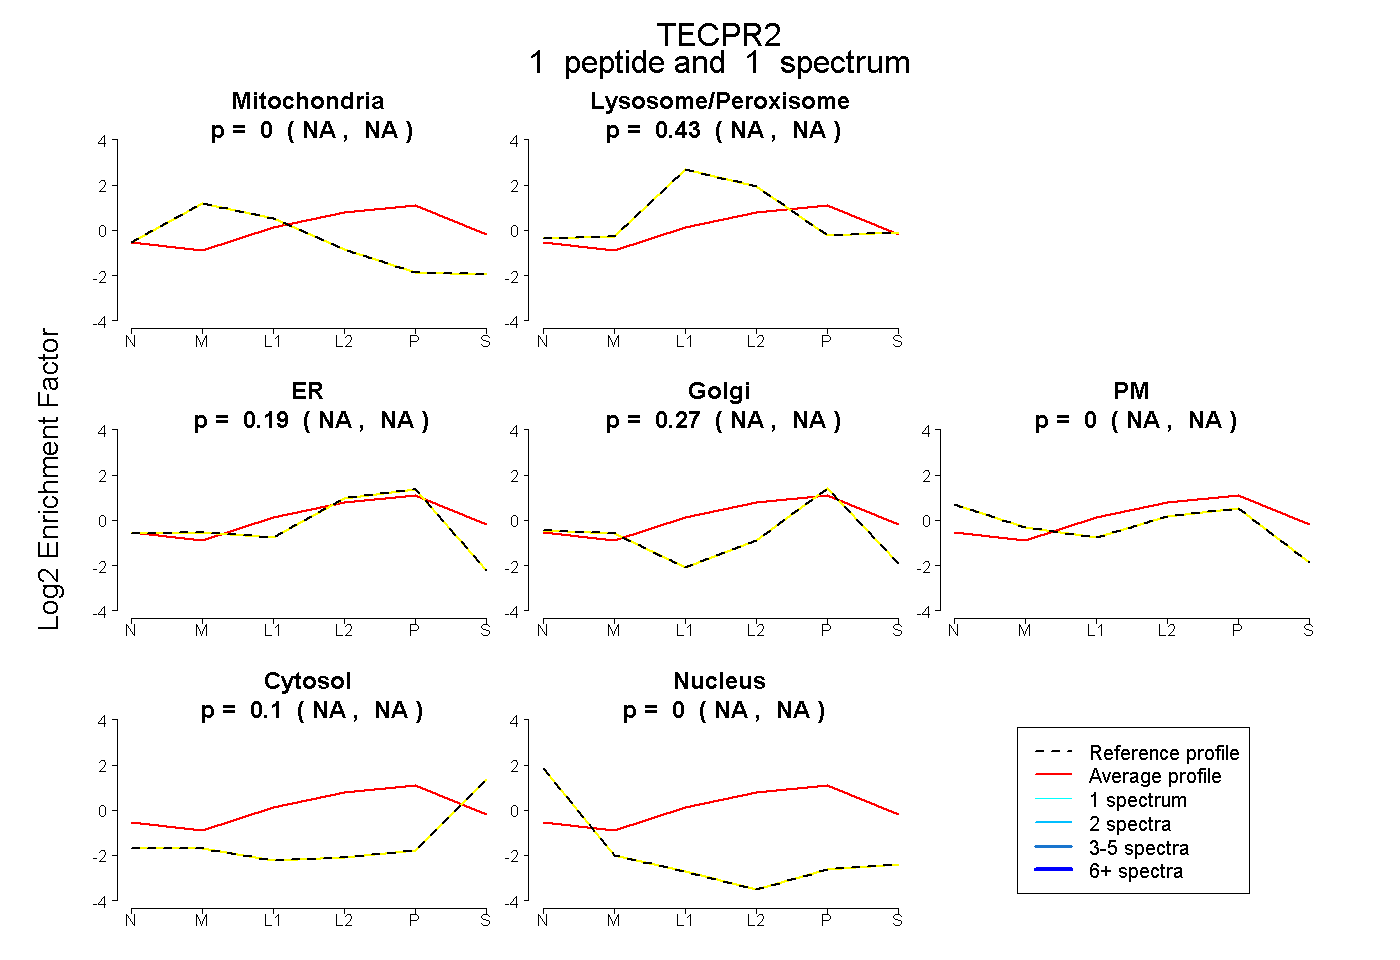
NA | NA
NA | NA
NA | NA
NA | NA
NA | NA
NA | NA
NA | NA
3peptides
spectra
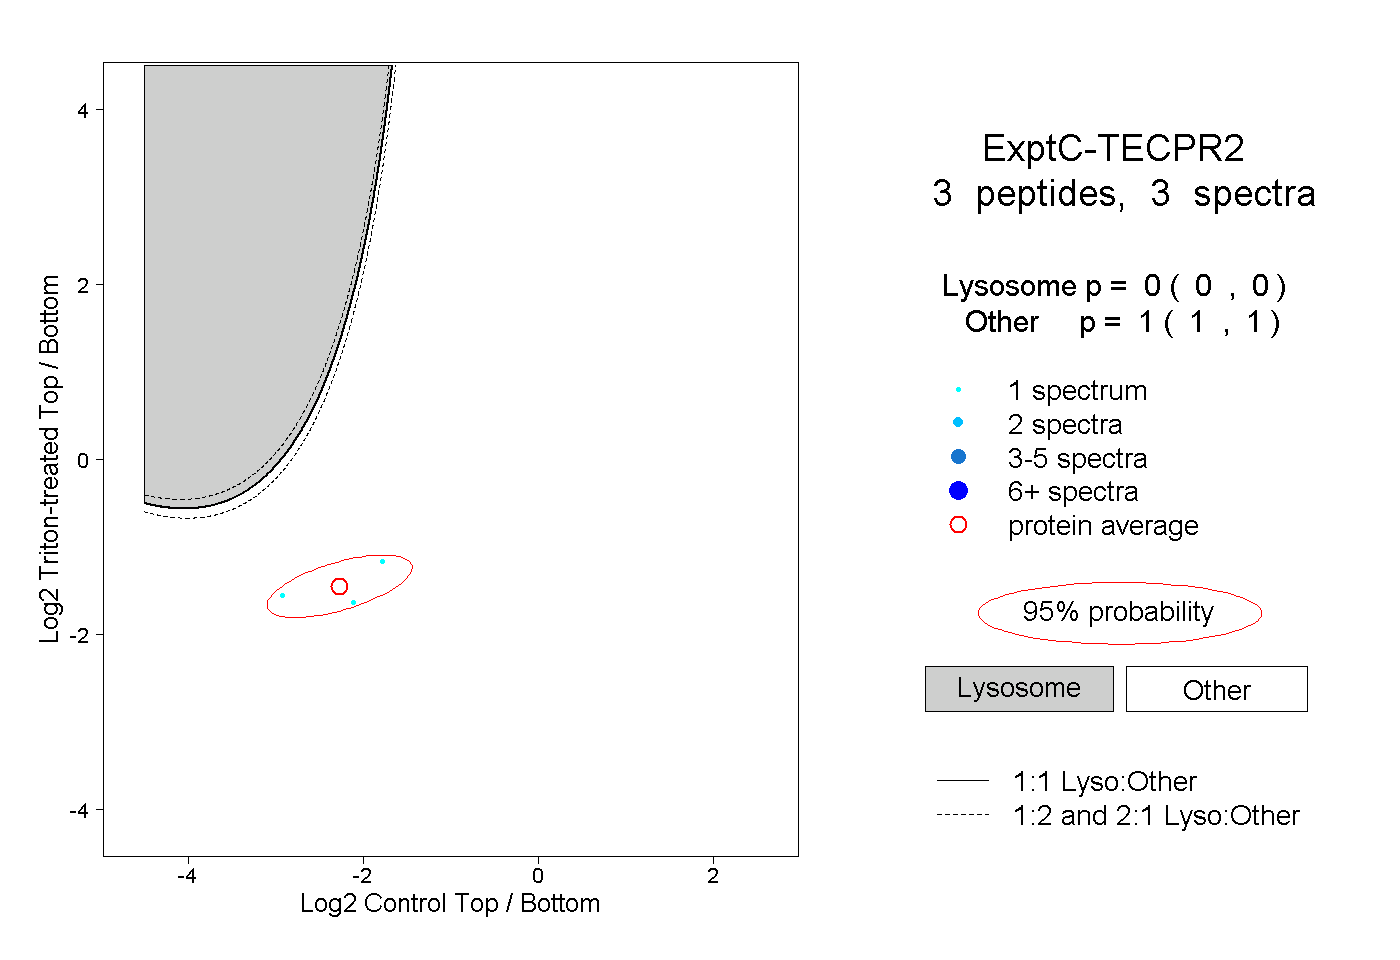
0.000 | 0.000
1.000 | 1.000