 1
1peptide
spectra
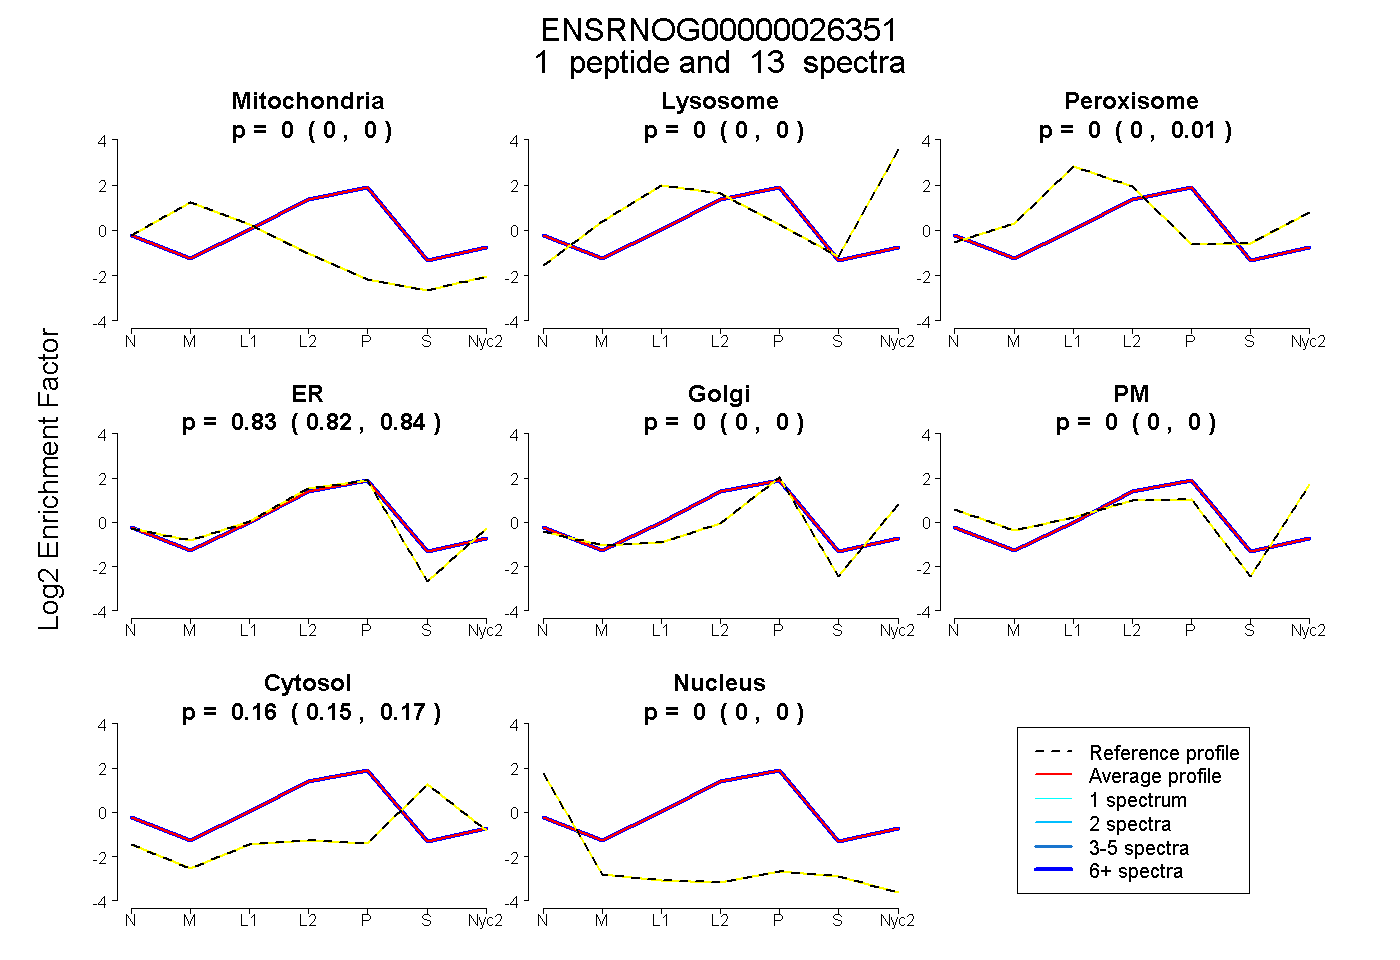
0.000 | 0.000
0.000 | 0.000
0.000 | 0.014
0.820 | 0.842
0.000 | 0.000
0.000 | 0.000
0.154 | 0.169
0.000 | 0.000
1peptide
spectra
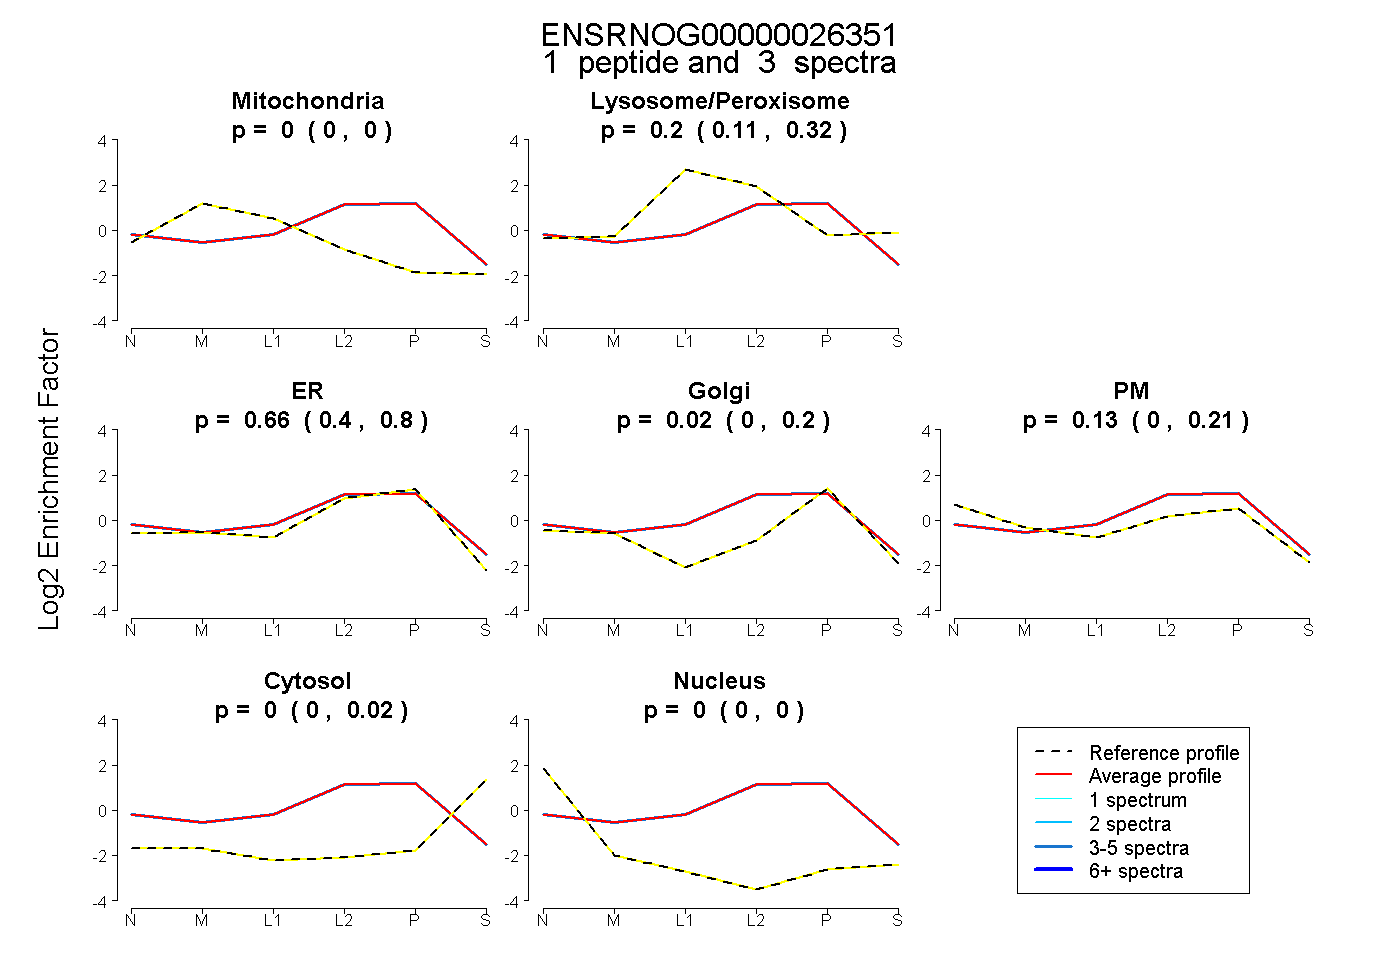
0.000 | 0.000
0.111 | 0.317
0.398 | 0.797
0.000 | 0.199
0.000 | 0.212
0.000 | 0.021
0.000 | 0.000
1peptide
spectra
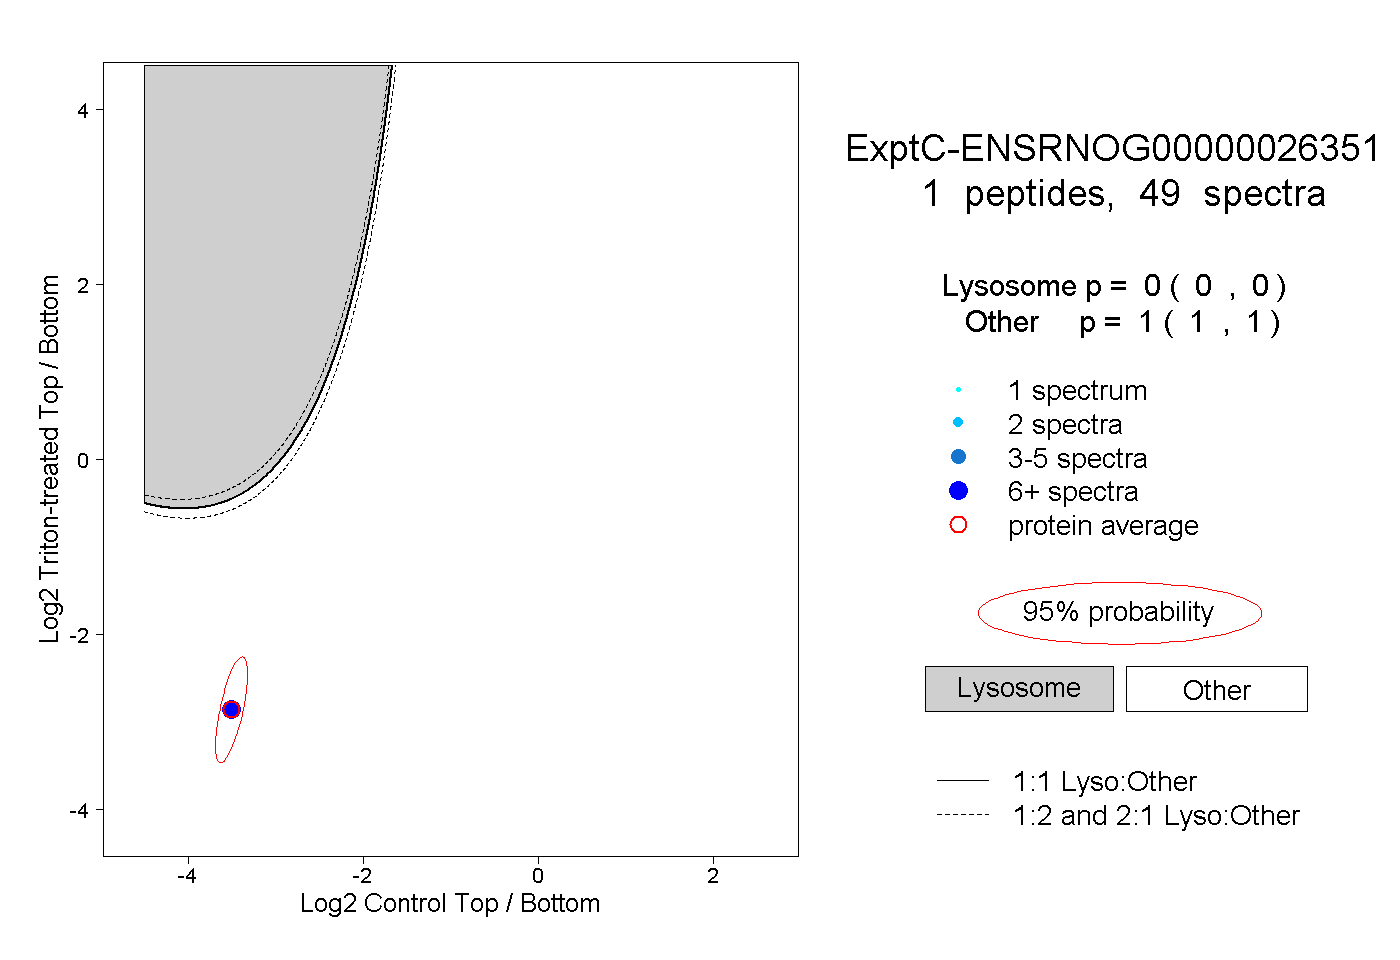
0.000 | 0.000
1.000 | 1.000
1peptide
spectrum
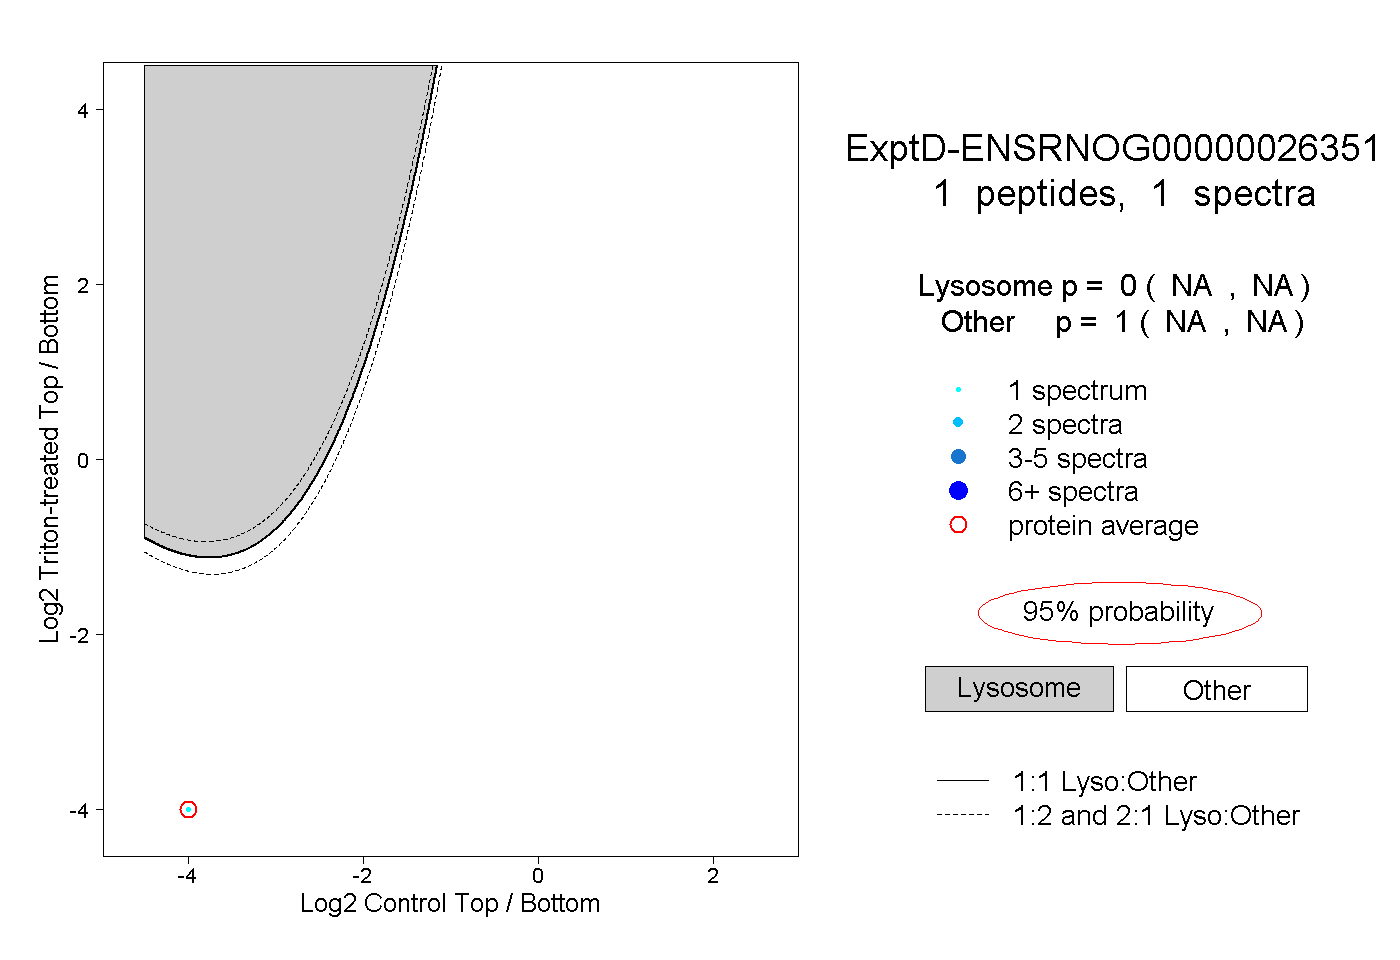
NA | NA
NA | NA