11
11peptides
spectra
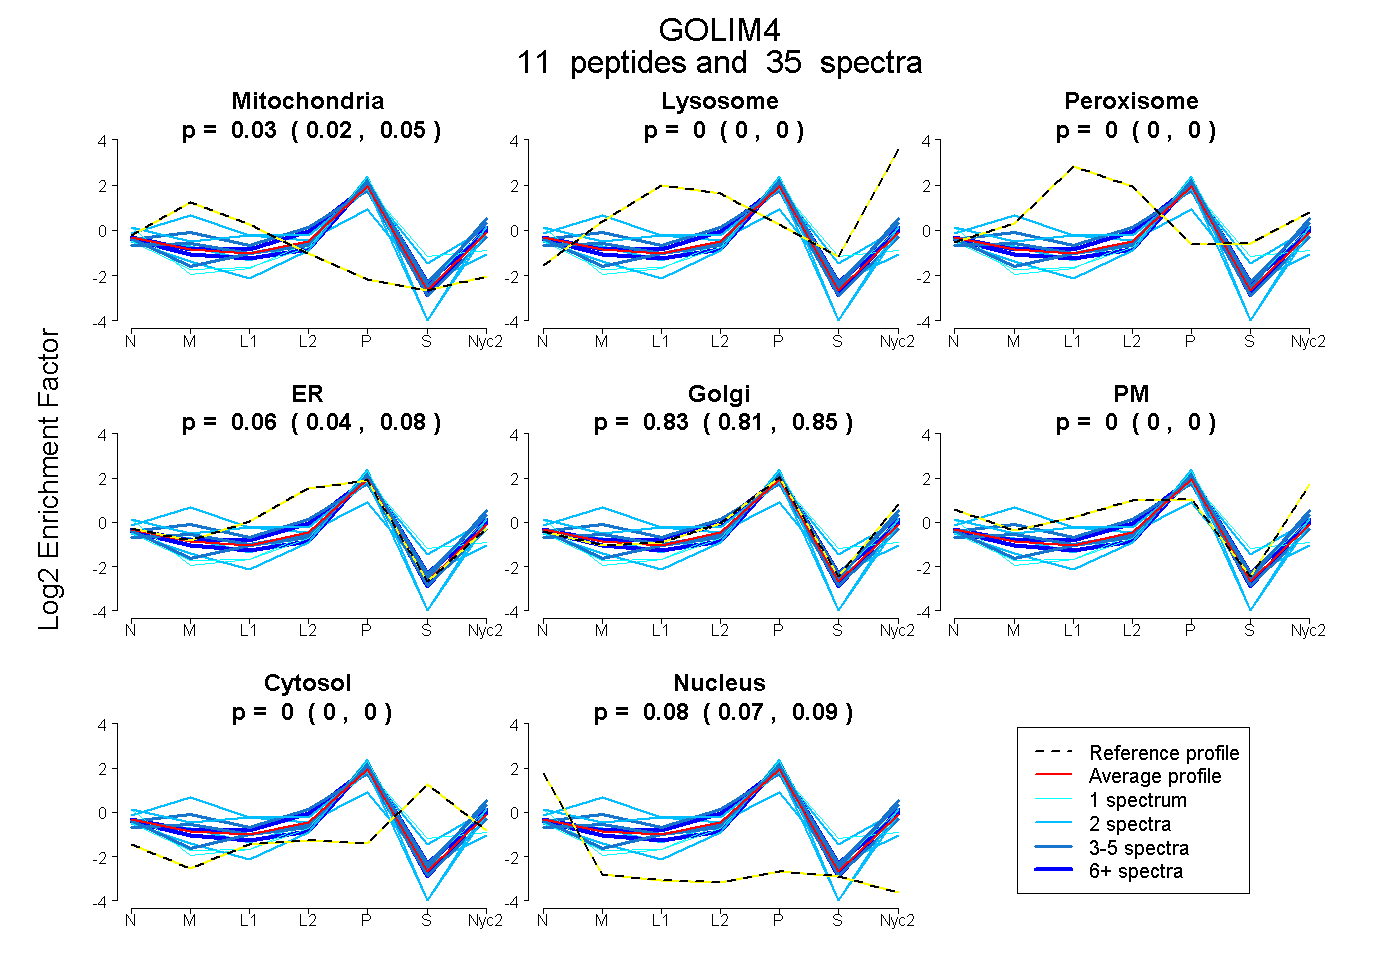
0.019 | 0.046
0.000 | 0.000
0.000 | 0.000
0.039 | 0.079
0.806 | 0.845
0.000 | 0.000
0.000 | 0.000
0.068 | 0.087
2peptides
spectra
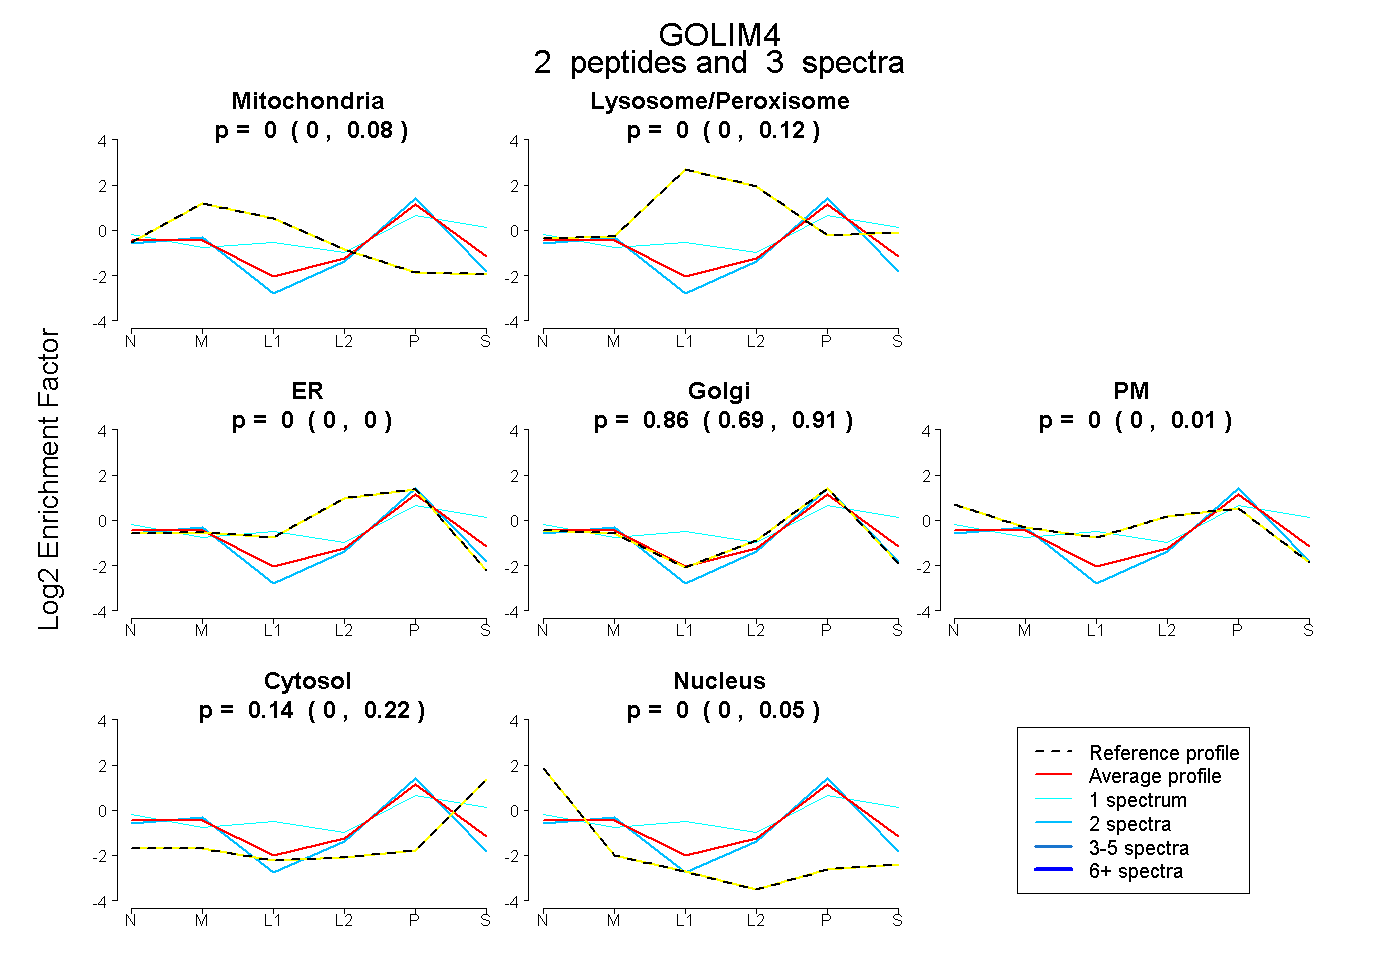
0.000 | 0.083
0.000 | 0.120
0.000 | 0.000
0.688 | 0.915
0.000 | 0.008
0.000 | 0.224
0.000 | 0.049
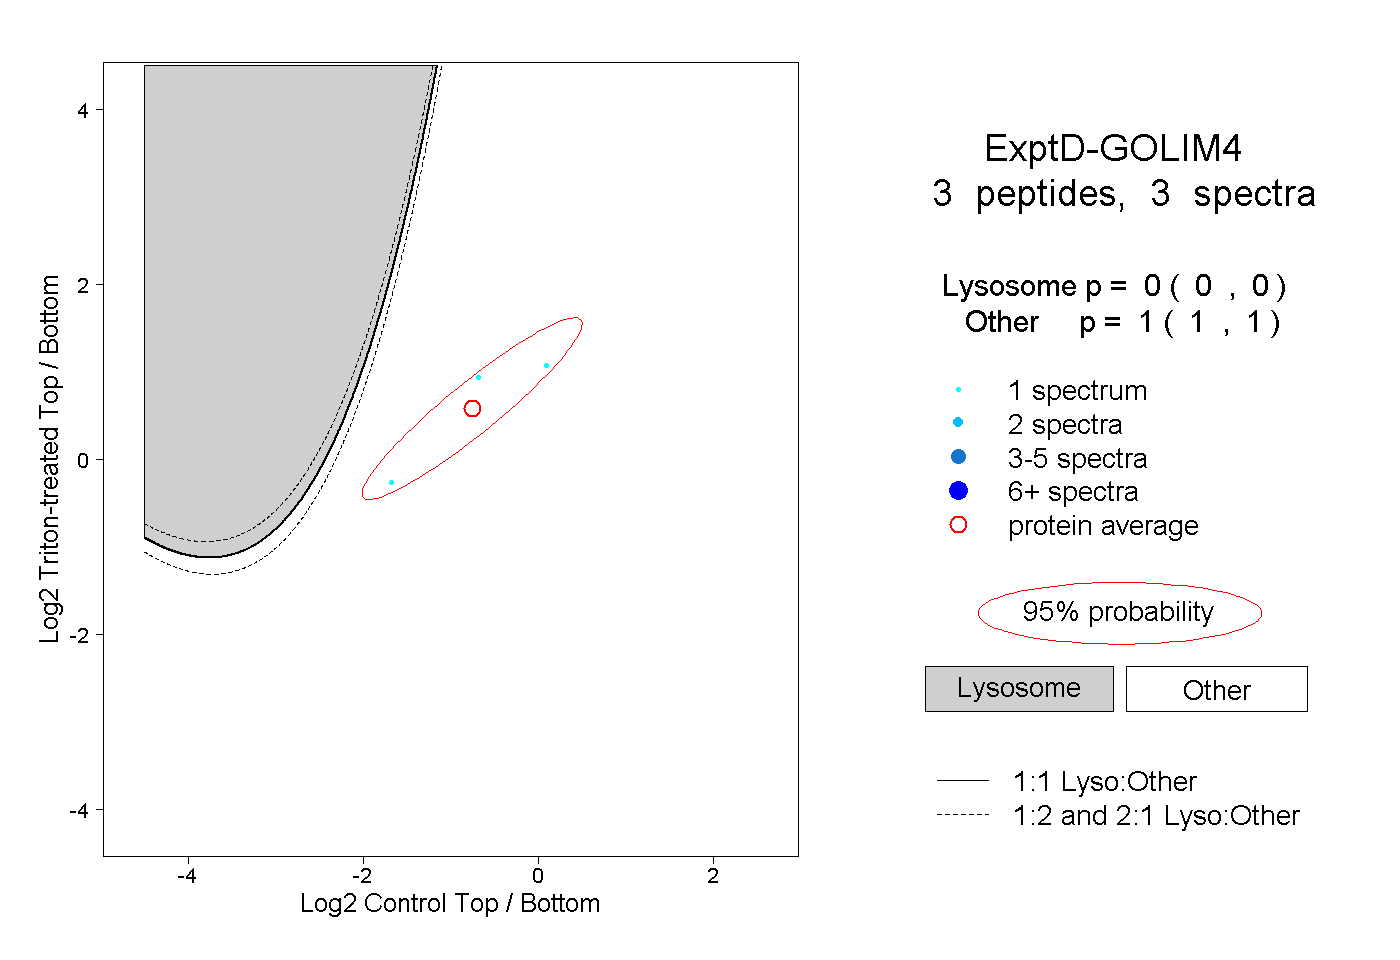
14peptides
spectra
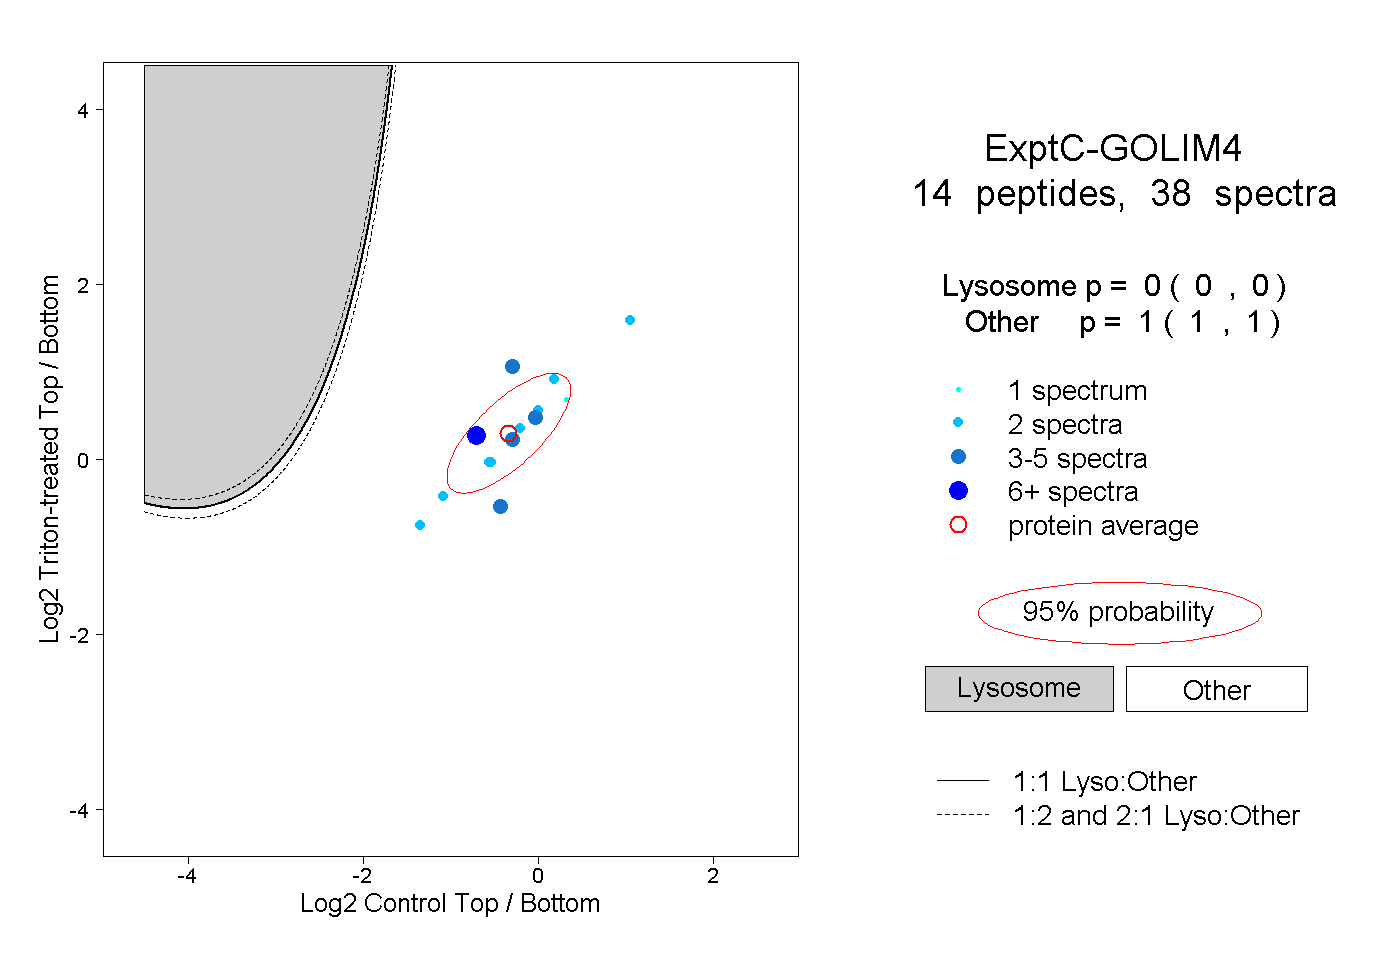
0.000 | 0.000
1.000 | 1.000