 11
11peptides
spectra
0.019 | 0.046
0.000 | 0.000
0.000 | 0.000
0.039 | 0.079
0.806 | 0.845
0.000 | 0.000
0.000 | 0.000
0.068 | 0.087
| Plot | Mito | Lyso | Perox | ER | Golgi | PM | Cytosol | Nucleus | |||||
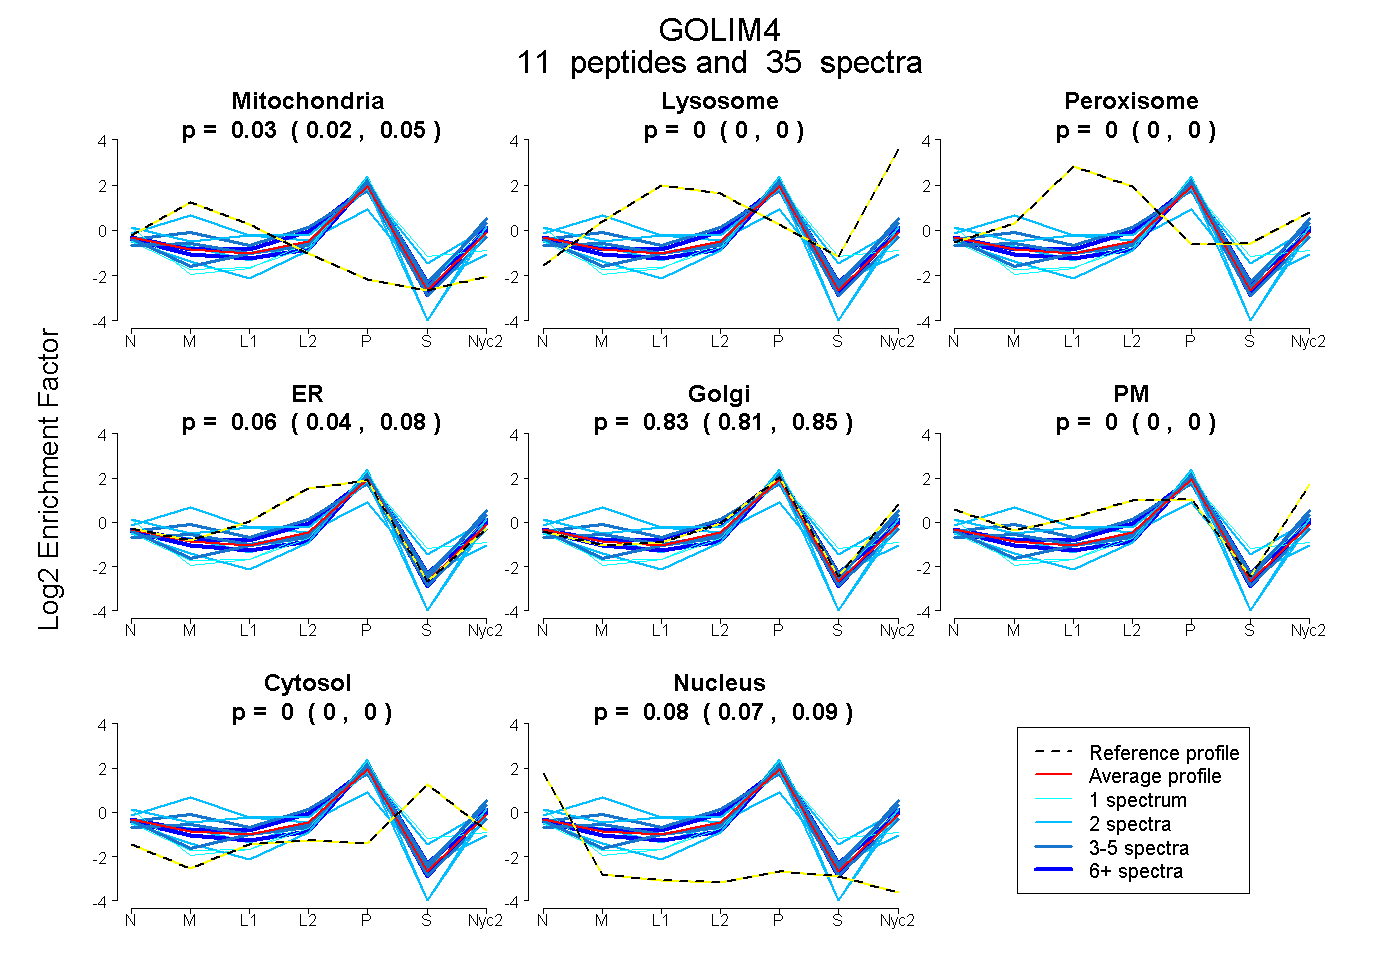
| Expt A |
11 peptides |
35 spectra |
|
0.034 0.019 | 0.046 |
0.000 0.000 | 0.000 |
0.000 0.000 | 0.000 |
0.061 0.039 | 0.079 |
0.828 0.806 | 0.845 |
0.000 0.000 | 0.000 |
0.000 0.000 | 0.000 |
0.078 0.068 | 0.087 |
| 2 spectra, AFNDHK | 0.429 | 0.000 | 0.000 | 0.205 | 0.366 | 0.000 | 0.000 | 0.000 | ||
| 4 spectra, LTGELQEGQQNHDAMPR | 0.164 | 0.000 | 0.000 | 0.302 | 0.534 | 0.000 | 0.000 | 0.000 | ||
| 2 spectra, QGEDFSR | 0.117 | 0.000 | 0.000 | 0.309 | 0.545 | 0.000 | 0.000 | 0.029 | ||
| 1 spectrum, QADHEEGQQQYQLR | 0.000 | 0.000 | 0.000 | 0.088 | 0.587 | 0.000 | 0.190 | 0.134 | ||
| 1 spectrum, TQVAEYK | 0.000 | 0.000 | 0.000 | 0.000 | 0.887 | 0.000 | 0.014 | 0.099 | ||
| 2 spectra, QQQQQQYLAR | 0.000 | 0.000 | 0.000 | 0.000 | 0.883 | 0.000 | 0.000 | 0.117 | ||
| 2 spectra, EHQEALHQQR | 0.015 | 0.000 | 0.000 | 0.000 | 0.816 | 0.000 | 0.155 | 0.014 | ||
| 9 spectra, LHGQLLR | 0.022 | 0.000 | 0.000 | 0.201 | 0.734 | 0.000 | 0.000 | 0.044 | ||
| 3 spectra, SPYEEQLEQQR | 0.000 | 0.000 | 0.000 | 0.000 | 0.941 | 0.000 | 0.000 | 0.059 | ||
| 3 spectra, YSALNVQHQMLK | 0.077 | 0.000 | 0.000 | 0.000 | 0.917 | 0.000 | 0.006 | 0.000 | ||
| 6 spectra, LEAQETLNK | 0.000 | 0.000 | 0.000 | 0.000 | 0.895 | 0.000 | 0.000 | 0.105 |
| Plot | Mito | Lyso or Perox | ER | Golgi | PM | Cytosol | Nucleus | ||||||
| Expt B |
2 peptides |
3 spectra |
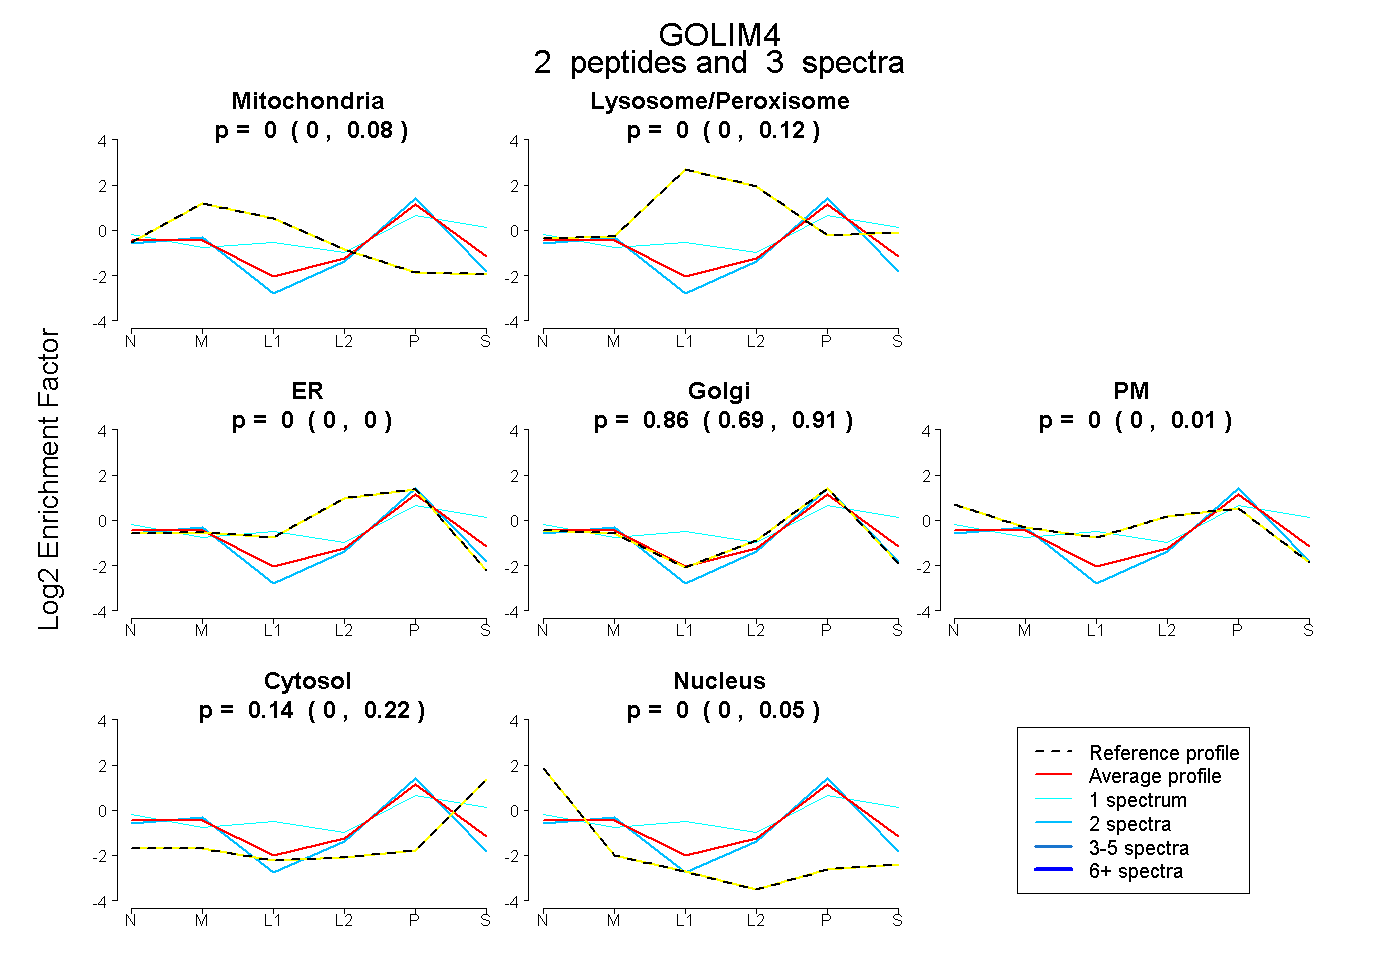 |
0.002 0.000 | 0.083 |
0.004 0.000 | 0.120 |
0.000 0.000 | 0.000 |
0.855 0.688 | 0.915 |
0.000 0.000 | 0.008 |
0.139 0.000 | 0.224 |
0.000 0.000 | 0.049 |
|||
| Plot | Lyso | Other | |||||||||||
| Expt C |
14 peptides |
38 spectra |
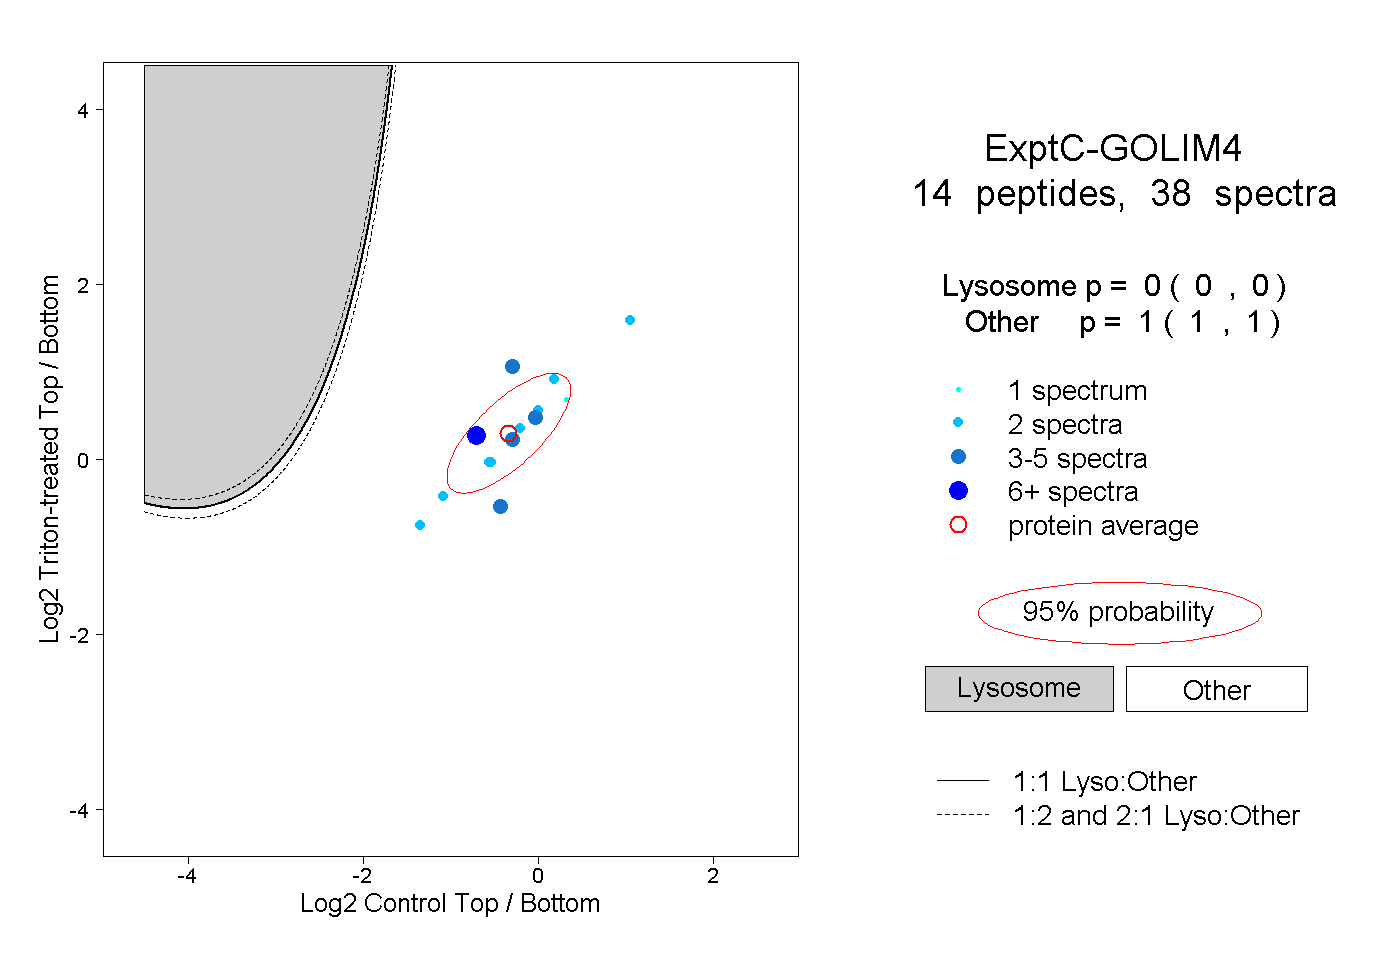 |
0.000 0.000 | 0.000 |
1.000 1.000 | 1.000 |
||||||||
| Plot | Lyso | Other | |||||||||||
| Expt D |
3 peptides |
3 spectra |
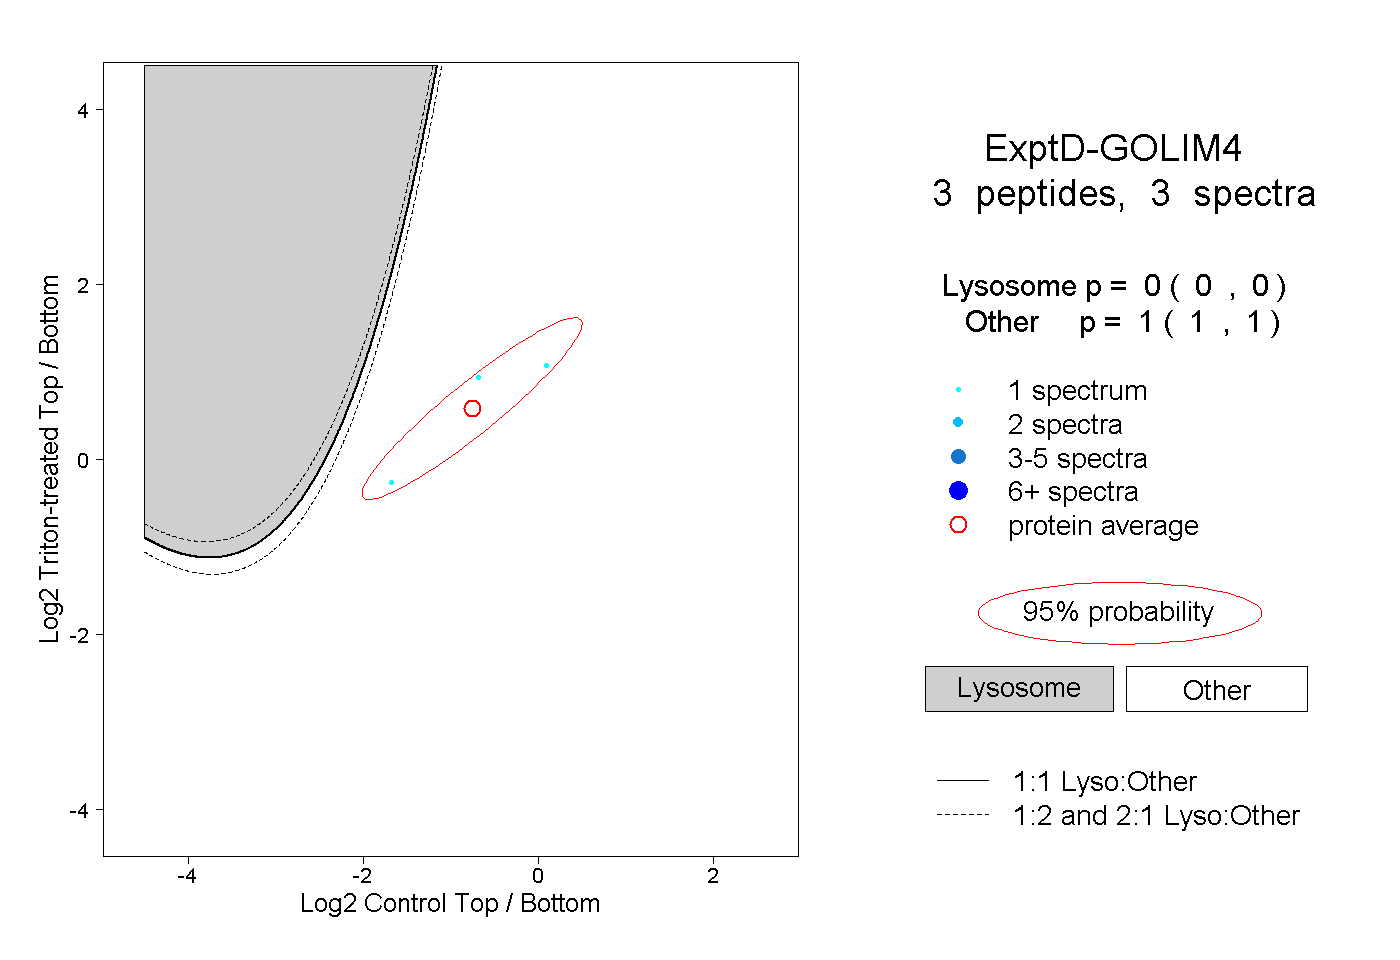 |
0.000 0.000 | 0.000 |
1.000 1.000 | 1.000 |