 2
2peptides
spectra
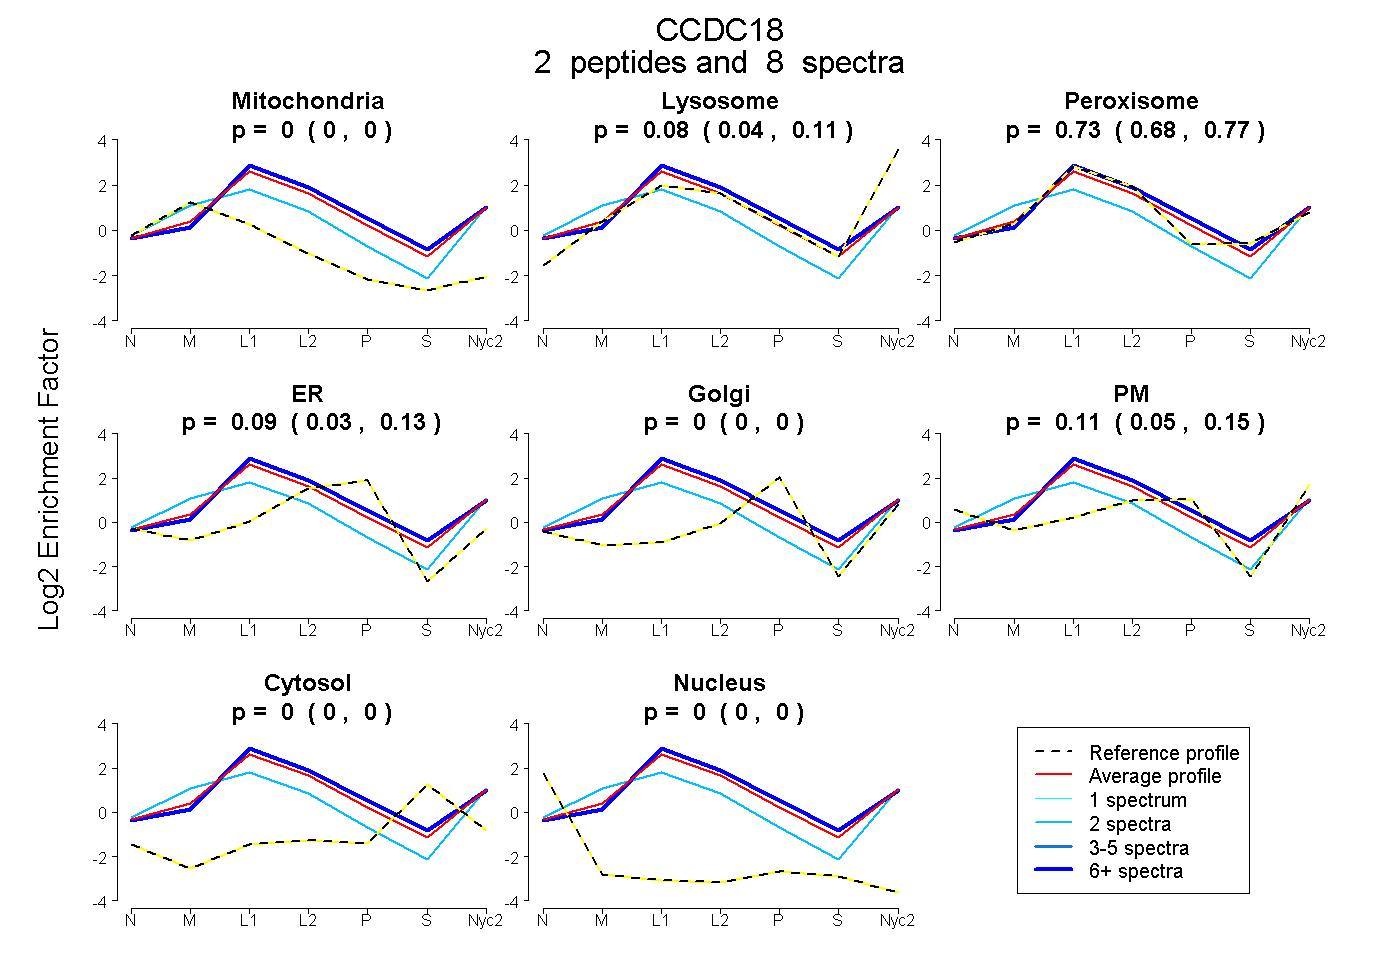
0.000 | 0.000
0.043 | 0.110
0.678 | 0.768
0.033 | 0.128
0.000 | 0.000
0.053 | 0.155
0.000 | 0.000
0.000 | 0.000
2peptides
spectra
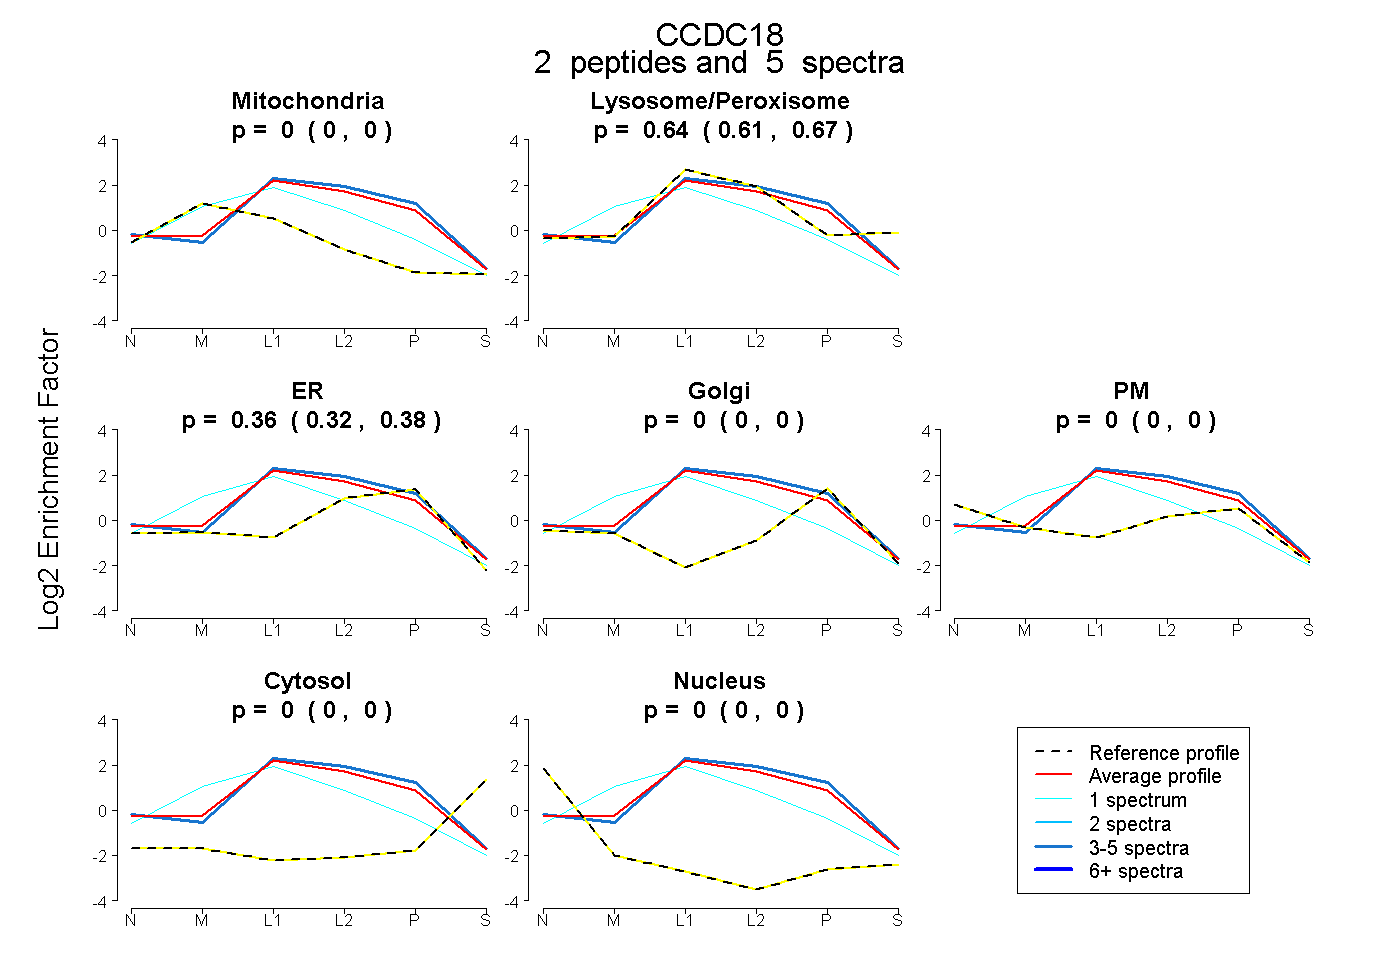
0.000 | 0.000
0.610 | 0.671
0.323 | 0.384
0.000 | 0.000
0.000 | 0.000
0.000 | 0.000
0.000 | 0.000
2peptides
spectra
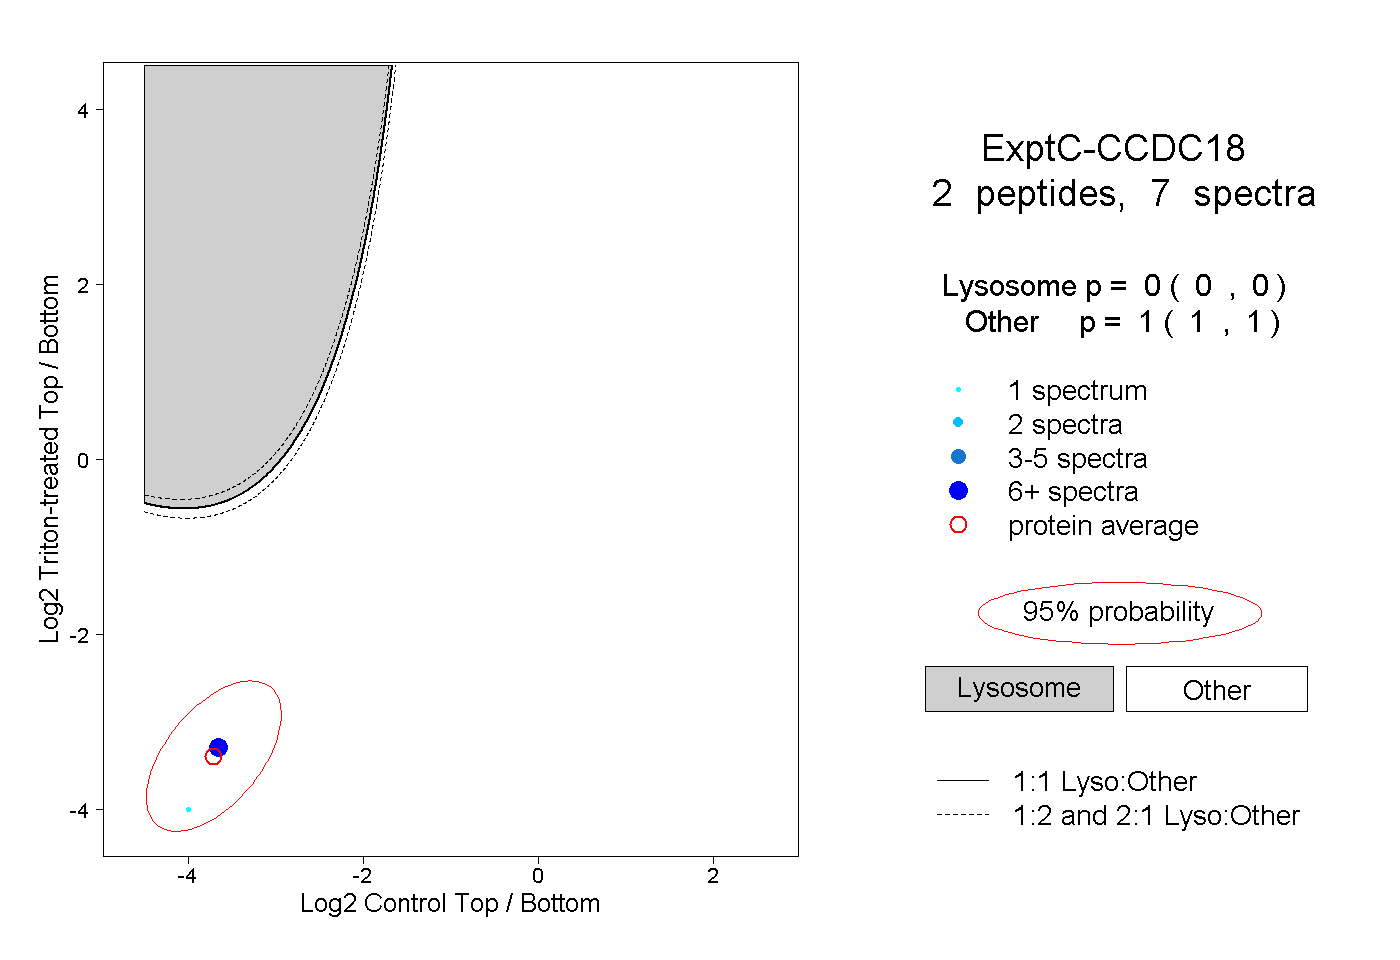
0.000 | 0.000
1.000 | 1.000