 1
1peptide
spectra
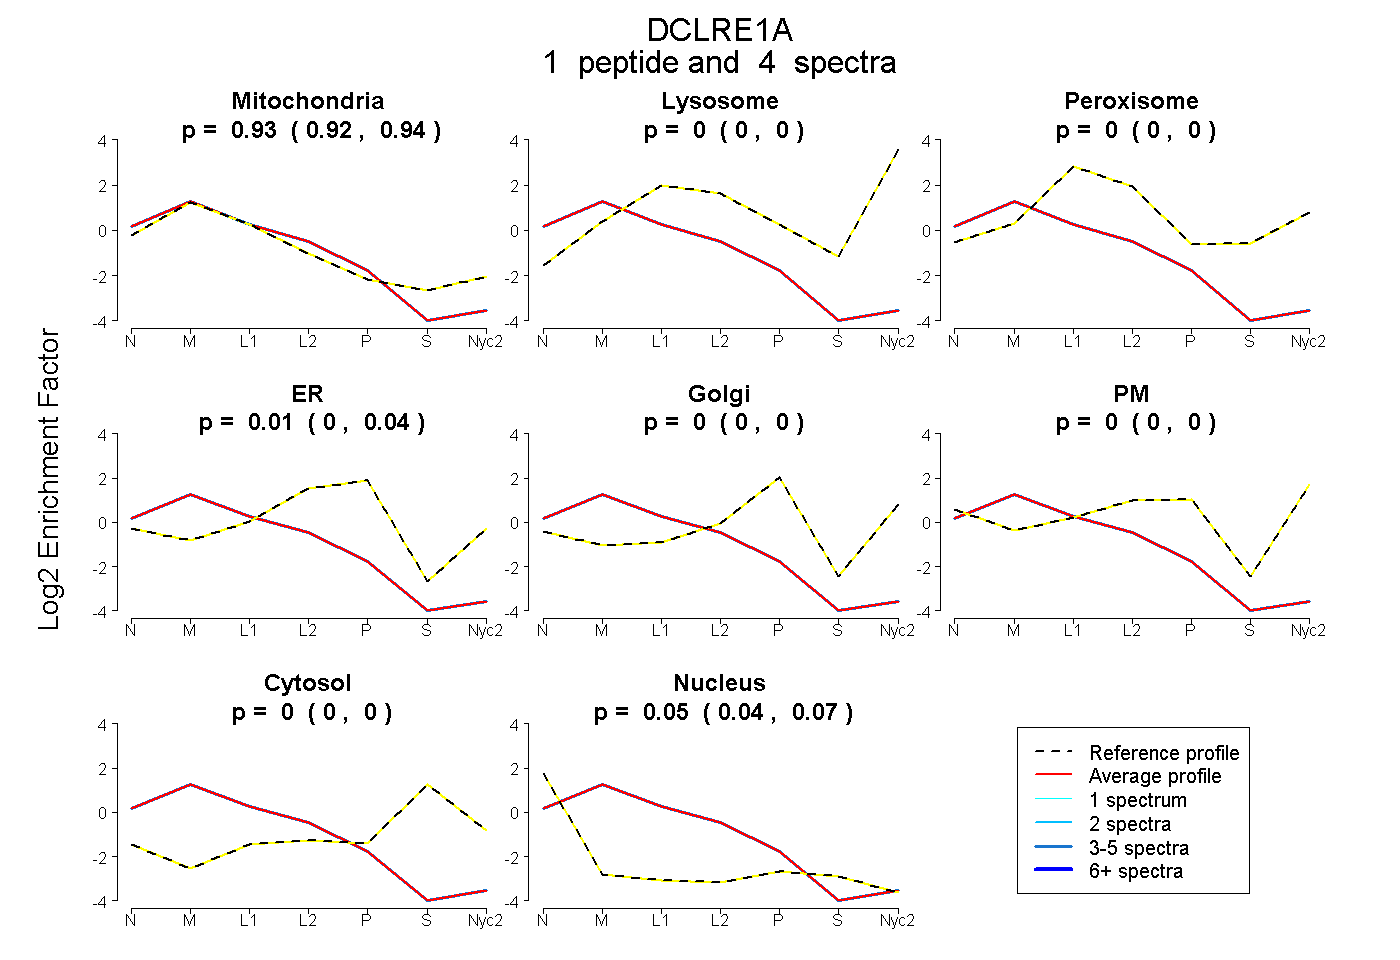
0.923 | 0.937
0.000 | 0.000
0.000 | 0.000
0.000 | 0.036
0.000 | 0.000
0.000 | 0.000
0.000 | 0.000
0.036 | 0.069
2peptides
spectra
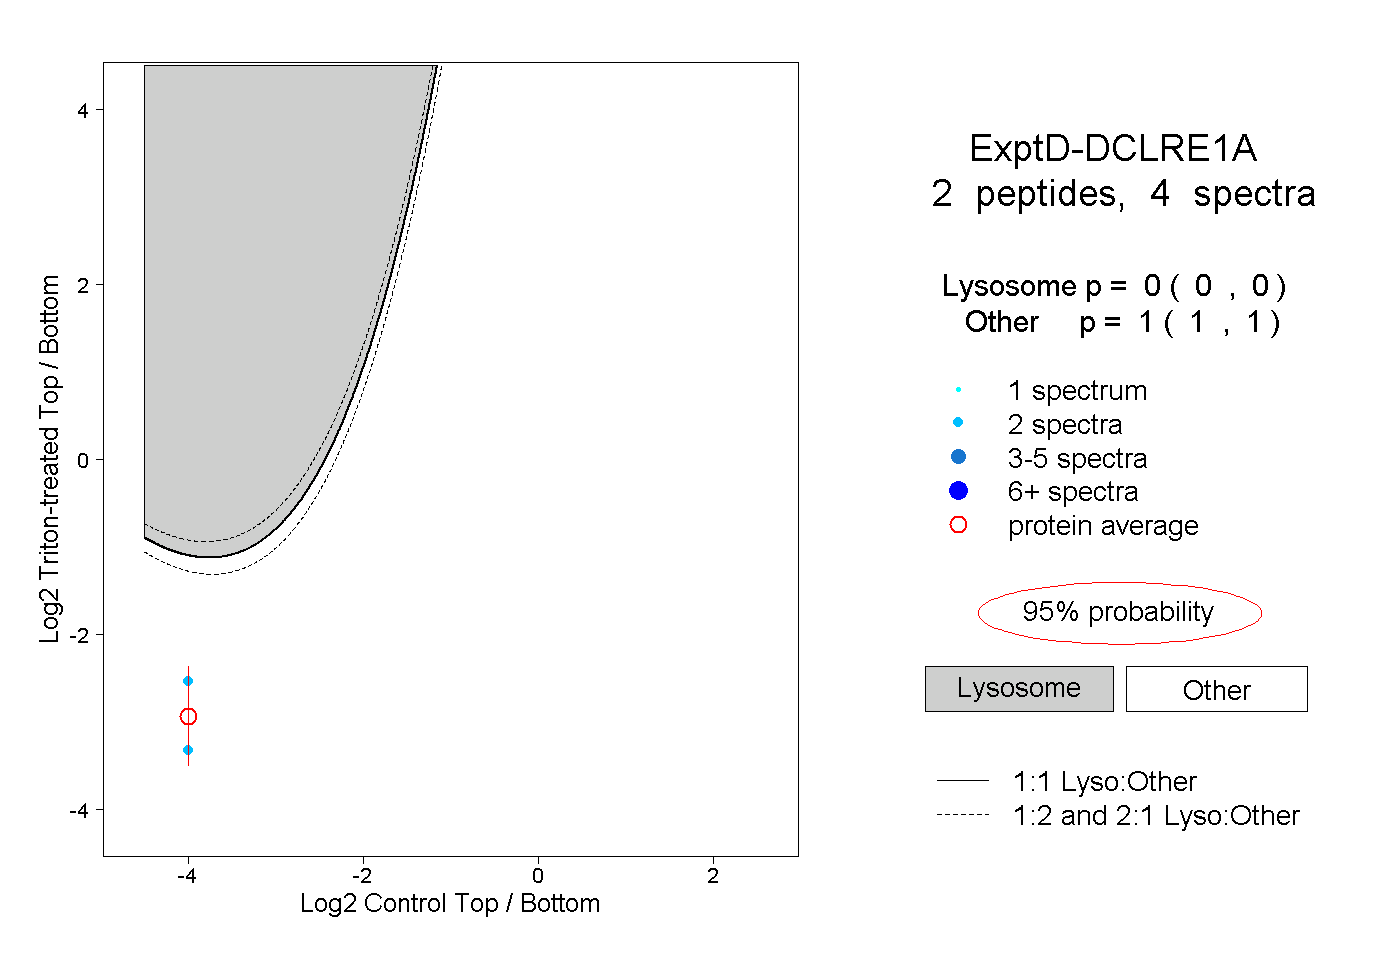
0.000 | 0.000
1.000 | 1.000
| Plot | Mito | Lyso | Perox | ER | Golgi | PM | Cytosol | Nucleus | |||||
| Expt A |
1 peptide |
4 spectra |
|
0.932 0.923 | 0.937 |
0.000 0.000 | 0.000 |
0.000 0.000 | 0.000 |
0.014 0.000 | 0.036 |
0.000 0.000 | 0.000 |
0.000 0.000 | 0.000 |
0.000 0.000 | 0.000 |
0.054 0.036 | 0.069 |
||
| Plot | Lyso | Other | |||||||||||
| Expt D |
2 peptides |
4 spectra |
|
0.000 0.000 | 0.000 |
1.000 1.000 | 1.000 |