 15
15peptides
spectra
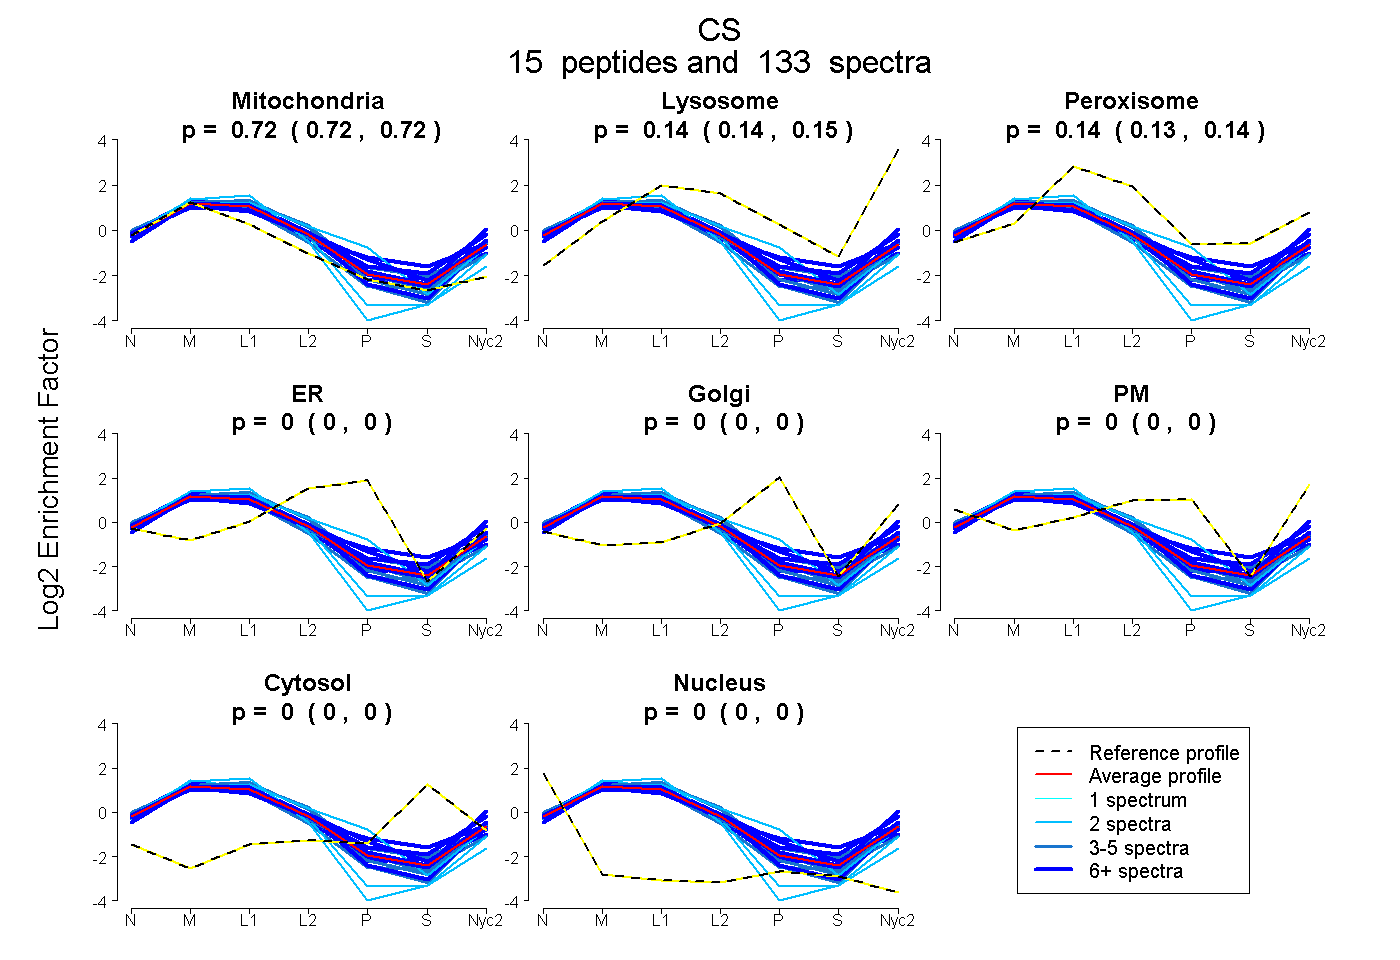
0.717 | 0.722
0.137 | 0.145
0.133 | 0.143
0.000 | 0.000
0.000 | 0.000
0.000 | 0.000
0.000 | 0.000
0.000 | 0.000
9peptides
spectra
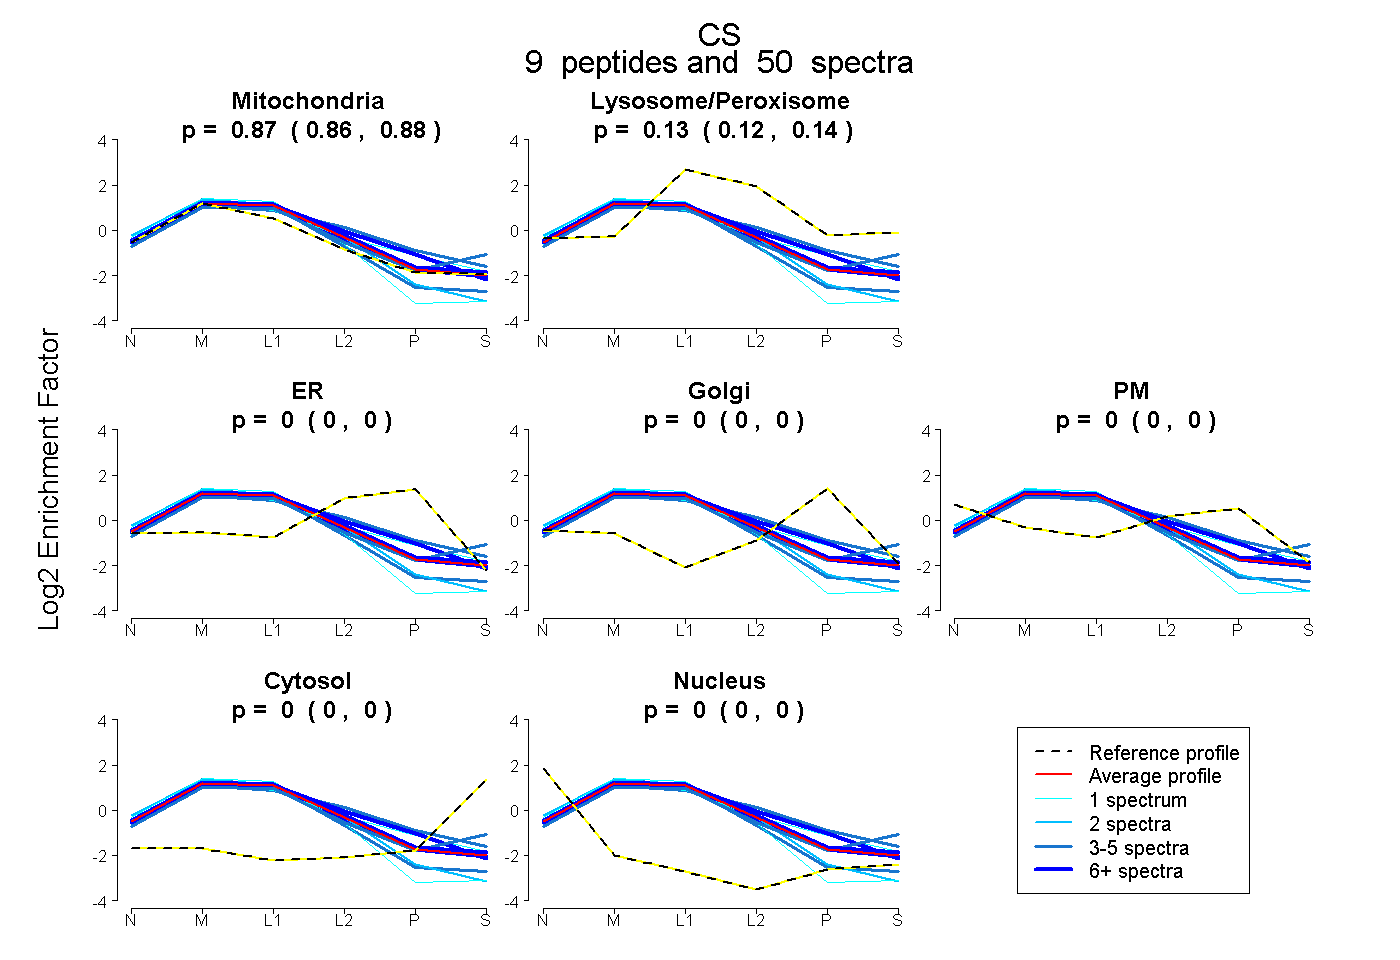
0.863 | 0.876
0.123 | 0.136
0.000 | 0.000
0.000 | 0.000
0.000 | 0.000
0.000 | 0.000
0.000 | 0.000
16peptides
spectra
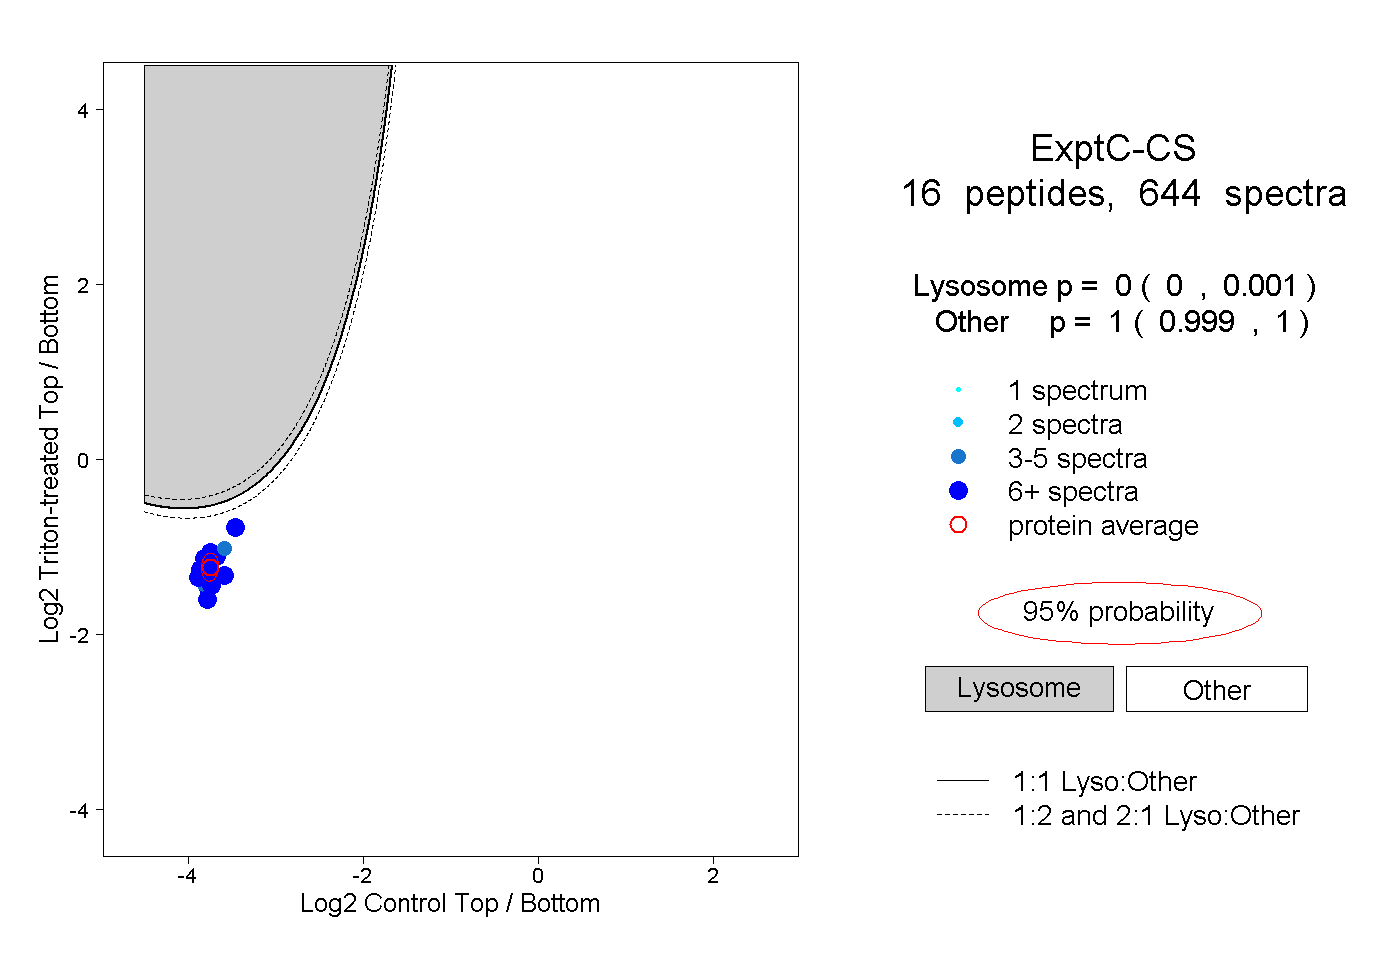
0.000 | 0.001
0.999 | 1.000
12peptides
spectra
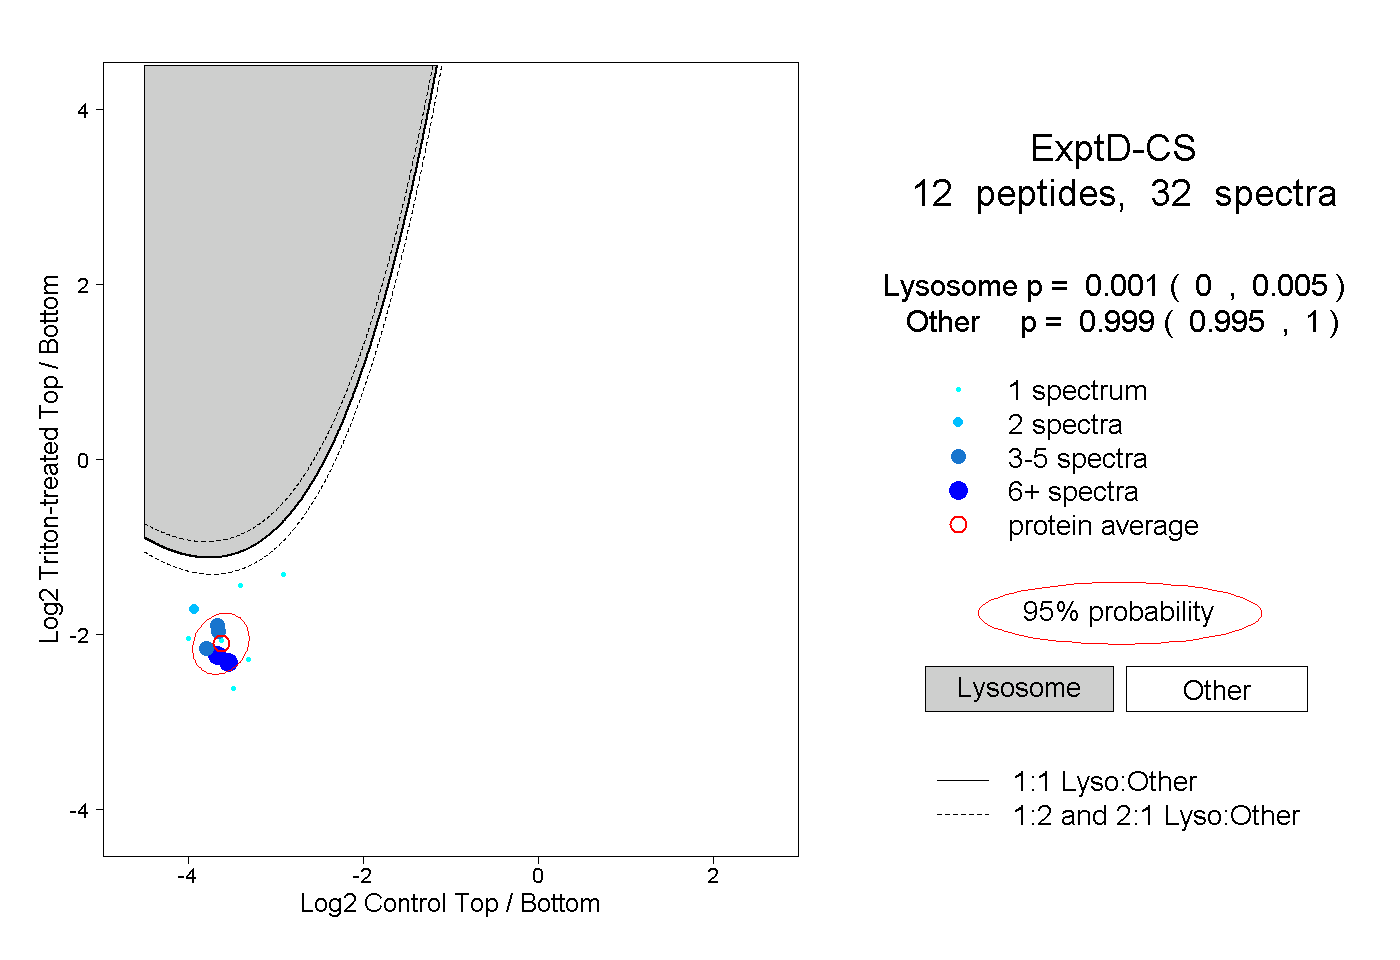
0.000 | 0.005
0.995 | 1.000