CS
[ENSRNOP00000034921]
Main page
| | | Plot |
Mito |
Lyso |
|
Perox |
ER |
Golgi |
PM |
Cytosol |
Nucleus |
|
| Expt A |
 15
15
peptides |
133
spectra |
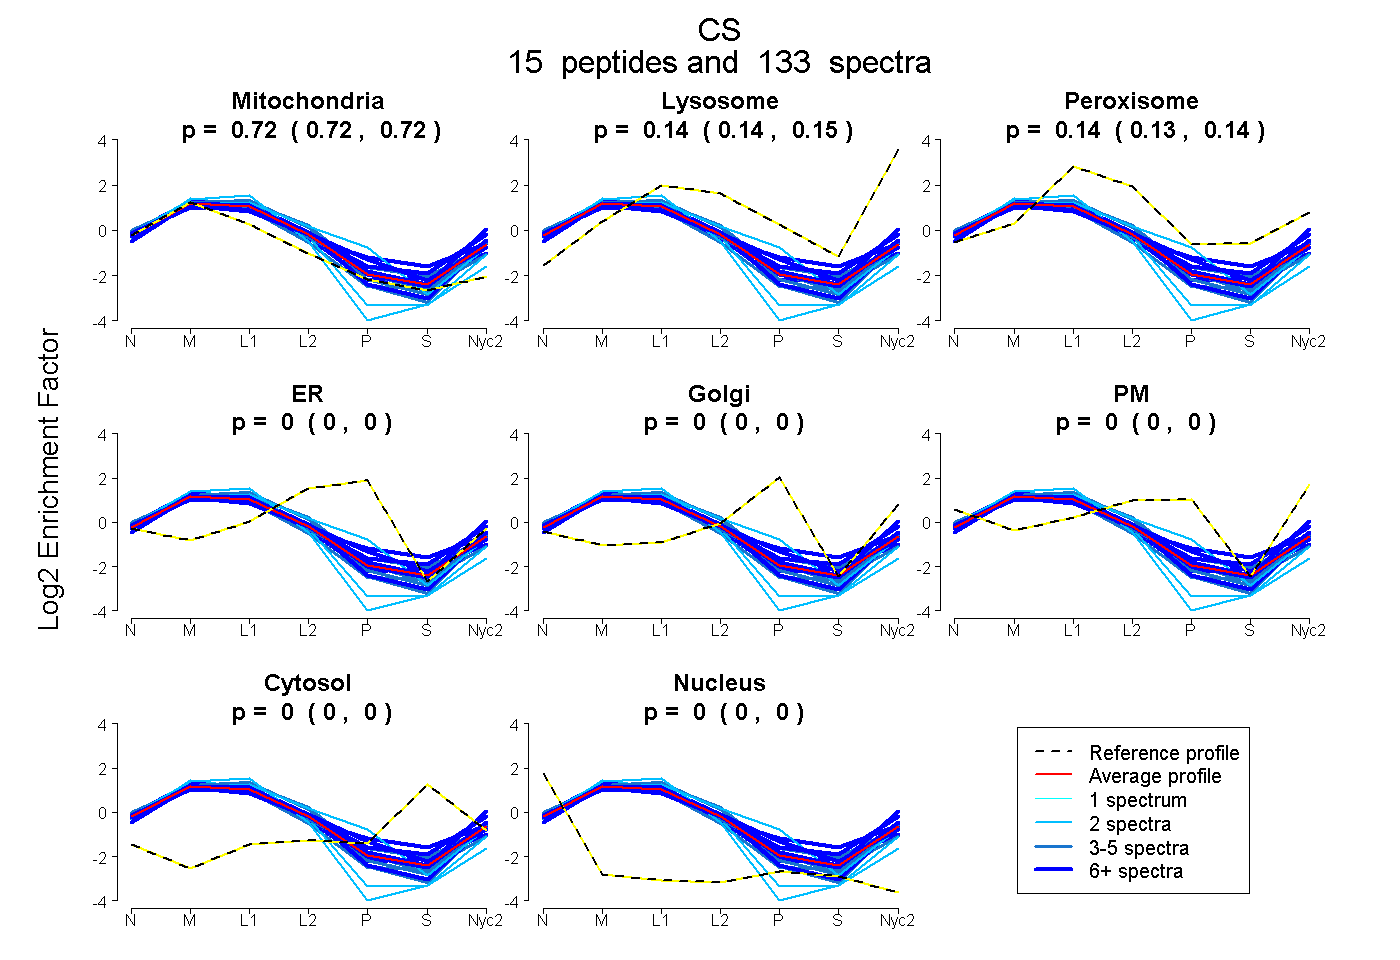 |
0.720
0.717 | 0.722 |
0.141
0.137 | 0.145 |
|
0.139
0.133 | 0.143 |
0.000
0.000 | 0.000 |
0.000
0.000 | 0.000 |
0.000
0.000 | 0.000 |
0.000
0.000 | 0.000 |
0.000
0.000 | 0.000 |
|
| | | Plot |
Mito |
|
Lyso or Perox |
|
ER |
Golgi |
PM |
Cytosol |
Nucleus |
|
| Expt B |
9
peptides |
50
spectra |
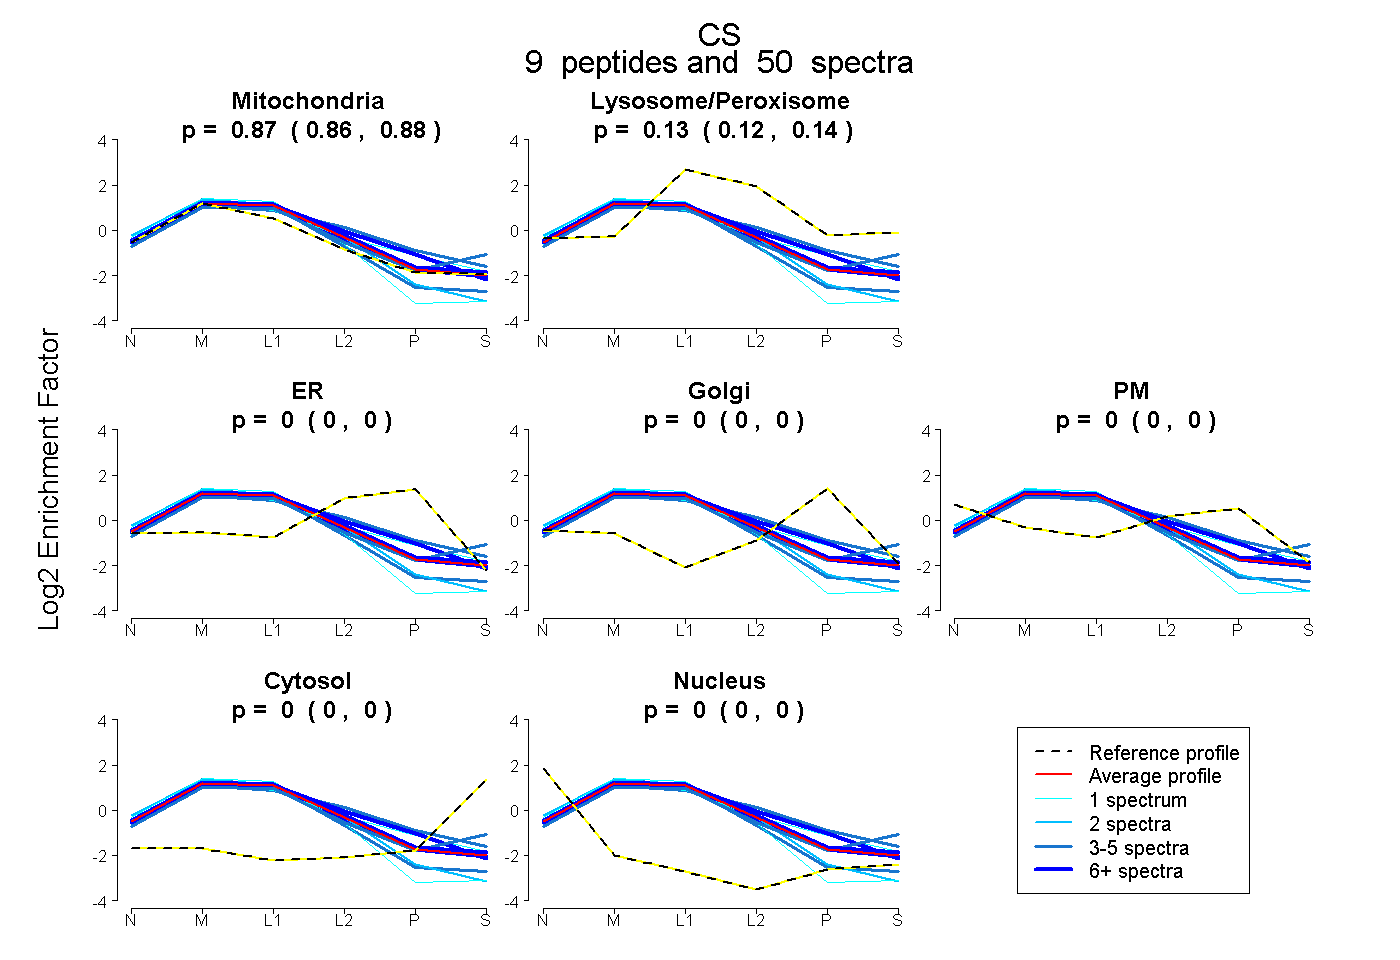 |
0.870
0.863 | 0.876 |
|
0.130
0.123 | 0.136 |
|
0.000
0.000 | 0.000 |
0.000
0.000 | 0.000 |
0.000
0.000 | 0.000 |
0.000
0.000 | 0.000 |
0.000
0.000 | 0.000 |
|
| 4 spectra, ALGFPLERPK |
1.000 |
|
0.000 |
|
0.000 |
0.000 |
0.000 |
0.000 |
0.000 |
|
| 4 spectra, DYIWNTLNSGR |
0.650 |
|
0.215 |
|
0.135 |
0.000 |
0.000 |
0.000 |
0.000 |
|
| 10 spectra, IVPNILLEQGK |
0.729 |
|
0.165 |
|
0.106 |
0.000 |
0.000 |
0.000 |
0.000 |
|
| 2 spectra, GYSIPECQK |
1.000 |
|
0.000 |
|
0.000 |
0.000 |
0.000 |
0.000 |
0.000 |
|
| 11 spectra, AYAEGINR |
0.879 |
|
0.121 |
|
0.000 |
0.000 |
0.000 |
0.000 |
0.000 |
|
| 1 spectrum, EGSSIGAIDSK |
0.778 |
|
0.136 |
|
0.086 |
0.000 |
0.000 |
0.000 |
0.000 |
|
| 12 spectra, VVPGYGHAVLR |
0.837 |
|
0.163 |
|
0.000 |
0.000 |
0.000 |
0.000 |
0.000 |
|
| 1 spectrum, LPCVAAK |
1.000 |
|
0.000 |
|
0.000 |
0.000 |
0.000 |
0.000 |
0.000 |
|
| 5 spectra, LVAQLYK |
0.760 |
|
0.174 |
|
0.000 |
0.000 |
0.000 |
0.065 |
0.000 |
|
| | | Plot |
|
Lyso |
|
|
|
|
|
|
|
Other |
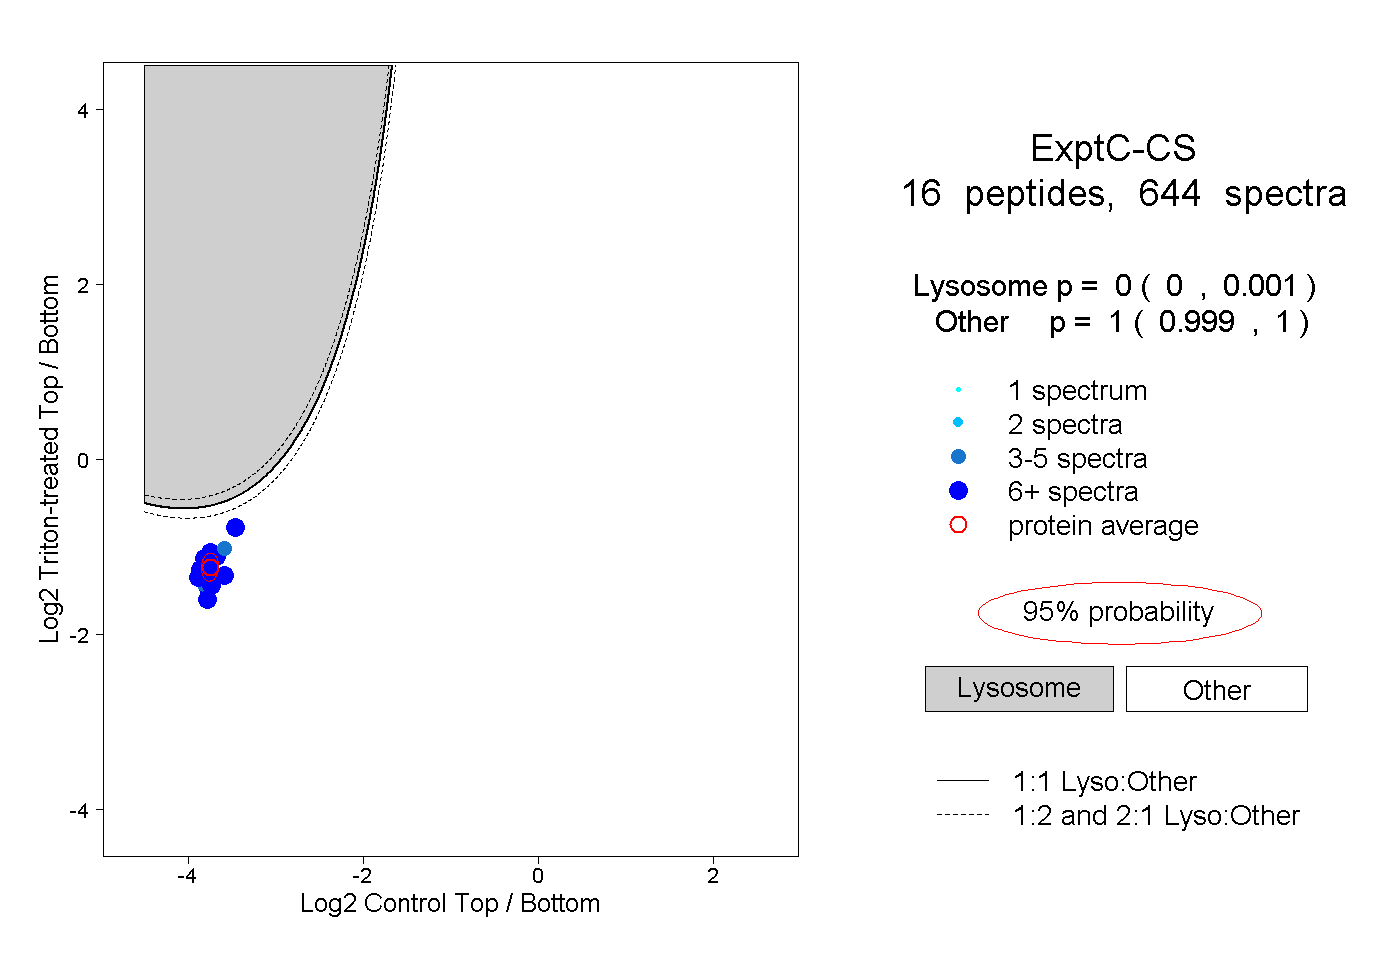
| Expt C |
16
peptides |
644
spectra |
 |
|
0.000
0.000 | 0.001 |
|
|
|
|
|
|
|
1.000
0.999 | 1.000 |
| | | Plot |
|
Lyso |
|
|
|
|
|
|
|
Other |
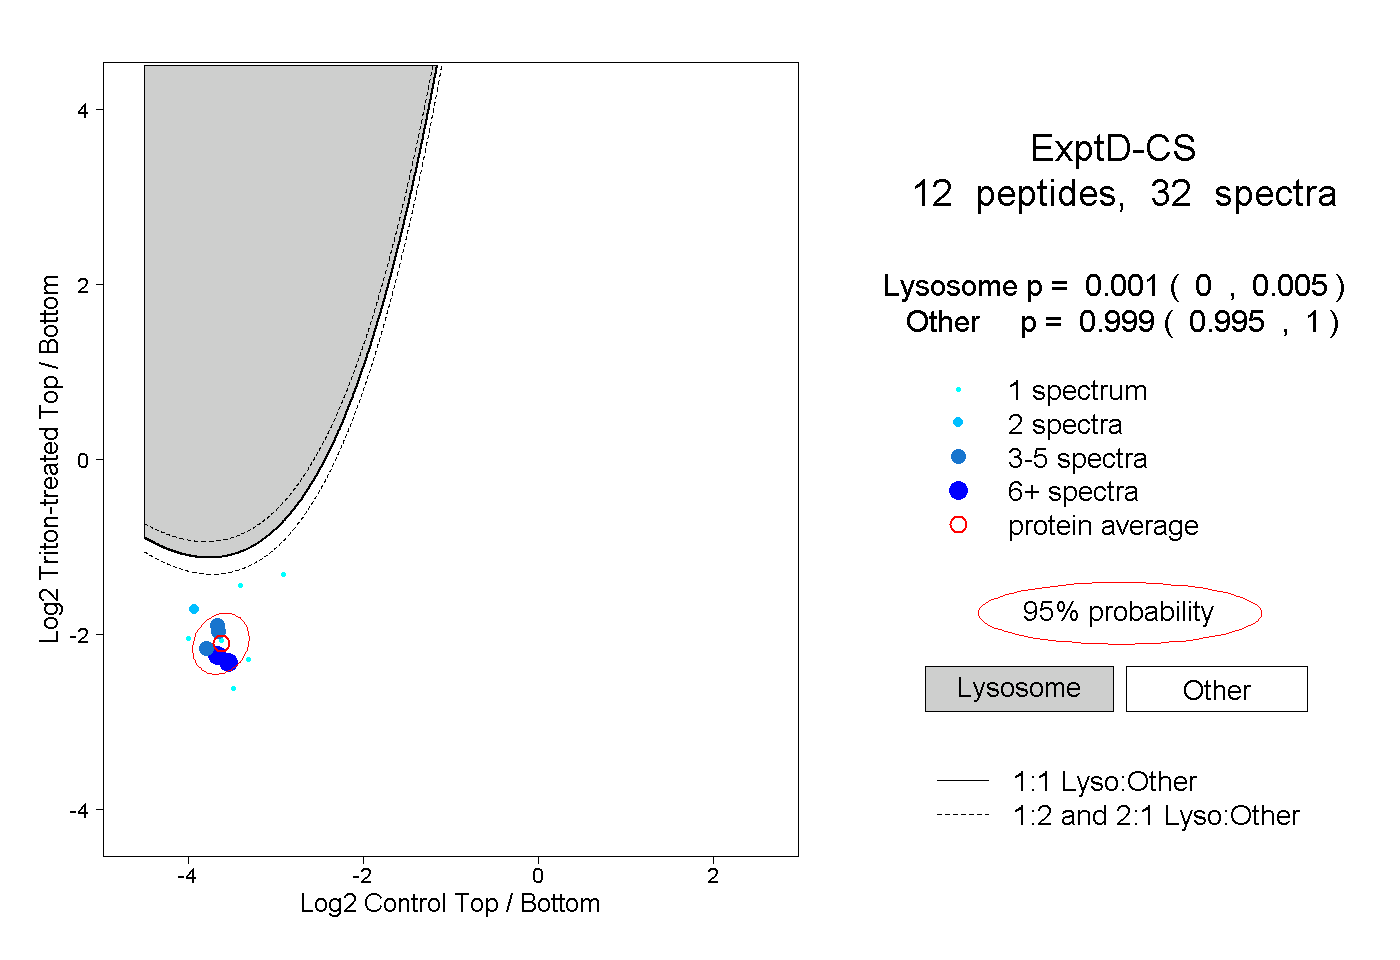
| Expt D |
12
peptides |
32
spectra |
 |
|
0.001
0.000 | 0.005 |
|
|
|
|
|
|
|
0.999
0.995 | 1.000 |