 15
15peptides
spectra
0.717 | 0.722
0.137 | 0.145
0.133 | 0.143
0.000 | 0.000
0.000 | 0.000
0.000 | 0.000
0.000 | 0.000
0.000 | 0.000
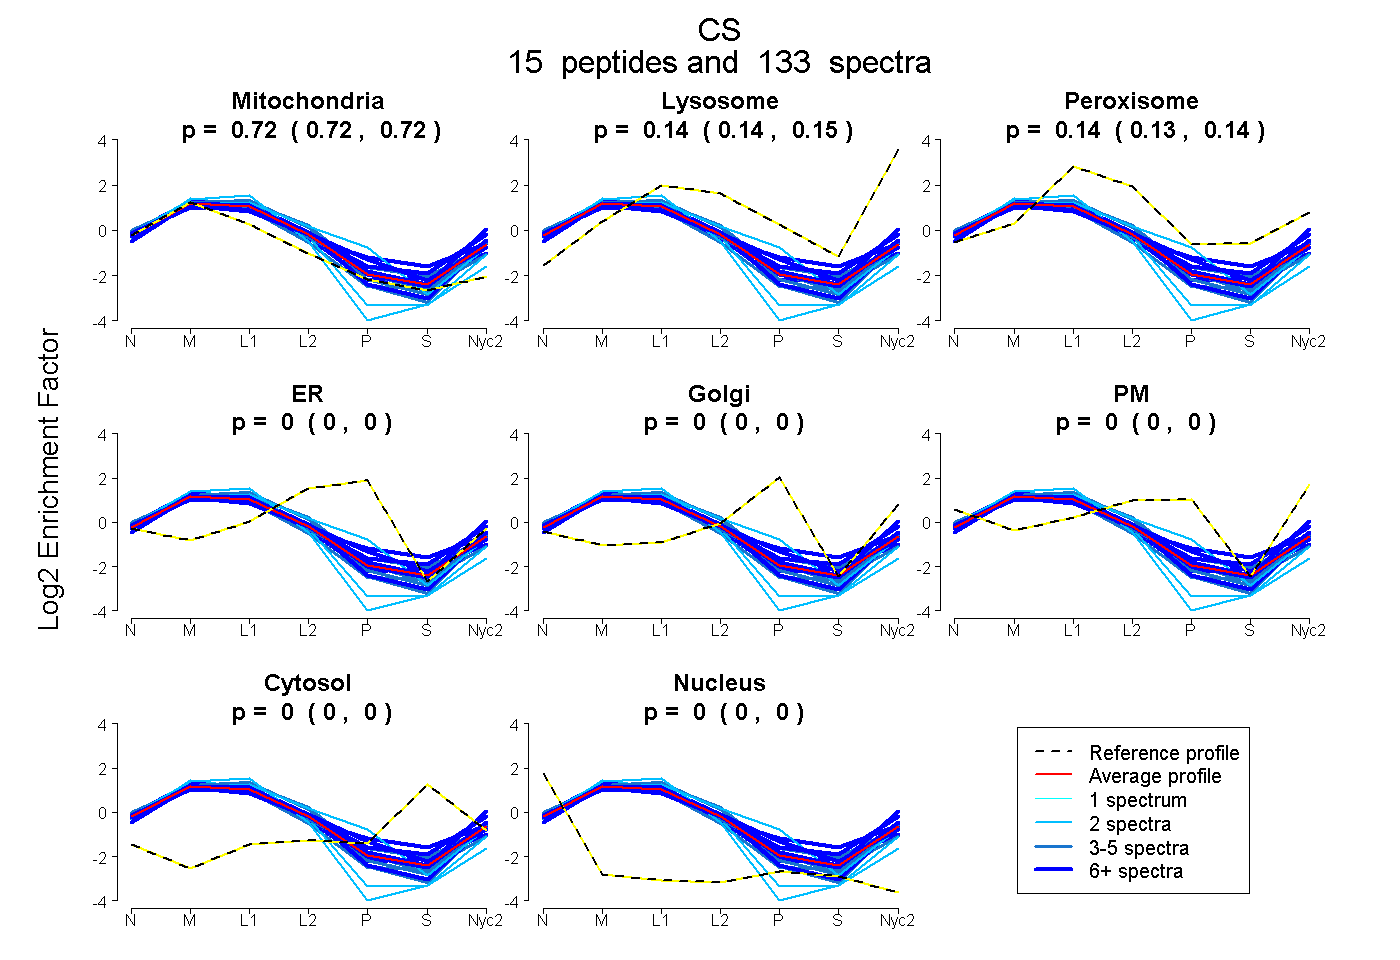
| Plot | Mito | Lyso | Perox | ER | Golgi | PM | Cytosol | Nucleus | |||||
| Expt A |
15 peptides |
133 spectra |
|
0.720 0.717 | 0.722 |
0.141 0.137 | 0.145 |
0.139 0.133 | 0.143 |
0.000 0.000 | 0.000 |
0.000 0.000 | 0.000 |
0.000 0.000 | 0.000 |
0.000 0.000 | 0.000 |
0.000 0.000 | 0.000 |
| 3 spectra, DILSNLIPK | 0.789 | 0.181 | 0.030 | 0.000 | 0.000 | 0.000 | 0.000 | 0.000 | ||
| 2 spectra, LDWSHNFTNMLGYTEPQFTELMR | 0.581 | 0.114 | 0.130 | 0.175 | 0.000 | 0.000 | 0.000 | 0.000 | ||
| 3 spectra, DVSDEK | 0.834 | 0.078 | 0.088 | 0.000 | 0.000 | 0.000 | 0.000 | 0.000 | ||
| 7 spectra, TVVGQITVDMMYGGMR | 0.681 | 0.288 | 0.000 | 0.000 | 0.000 | 0.030 | 0.000 | 0.000 | ||
| 12 spectra, ALGFPLERPK | 0.741 | 0.021 | 0.239 | 0.000 | 0.000 | 0.000 | 0.000 | 0.000 | ||
| 4 spectra, IVPNILLEQGK | 0.655 | 0.111 | 0.195 | 0.000 | 0.000 | 0.038 | 0.000 | 0.000 | ||
| 2 spectra, DYIWNTLNSGR | 0.883 | 0.052 | 0.065 | 0.000 | 0.000 | 0.000 | 0.000 | 0.000 | ||
| 5 spectra, GLVYETSVLDPDEGIR | 0.698 | 0.105 | 0.196 | 0.000 | 0.000 | 0.000 | 0.000 | 0.000 | ||
| 5 spectra, GYSIPECQK | 0.678 | 0.109 | 0.213 | 0.000 | 0.000 | 0.000 | 0.000 | 0.000 | ||
| 22 spectra, AYAEGINR | 0.594 | 0.090 | 0.211 | 0.000 | 0.000 | 0.065 | 0.041 | 0.000 | ||
| 8 spectra, EGSSIGAIDSK | 0.772 | 0.167 | 0.062 | 0.000 | 0.000 | 0.000 | 0.000 | 0.000 | ||
| 37 spectra, VVPGYGHAVLR | 0.657 | 0.068 | 0.172 | 0.000 | 0.000 | 0.103 | 0.000 | 0.000 | ||
| 8 spectra, SMSTDGLMK | 0.641 | 0.241 | 0.118 | 0.000 | 0.000 | 0.000 | 0.000 | 0.000 | ||
| 2 spectra, LPCVAAK | 0.945 | 0.000 | 0.055 | 0.000 | 0.000 | 0.000 | 0.000 | 0.000 | ||
| 13 spectra, LVAQLYK | 0.727 | 0.210 | 0.063 | 0.000 | 0.000 | 0.000 | 0.000 | 0.000 |
| Plot | Mito | Lyso or Perox | ER | Golgi | PM | Cytosol | Nucleus | ||||||
| Expt B |
9 peptides |
50 spectra |
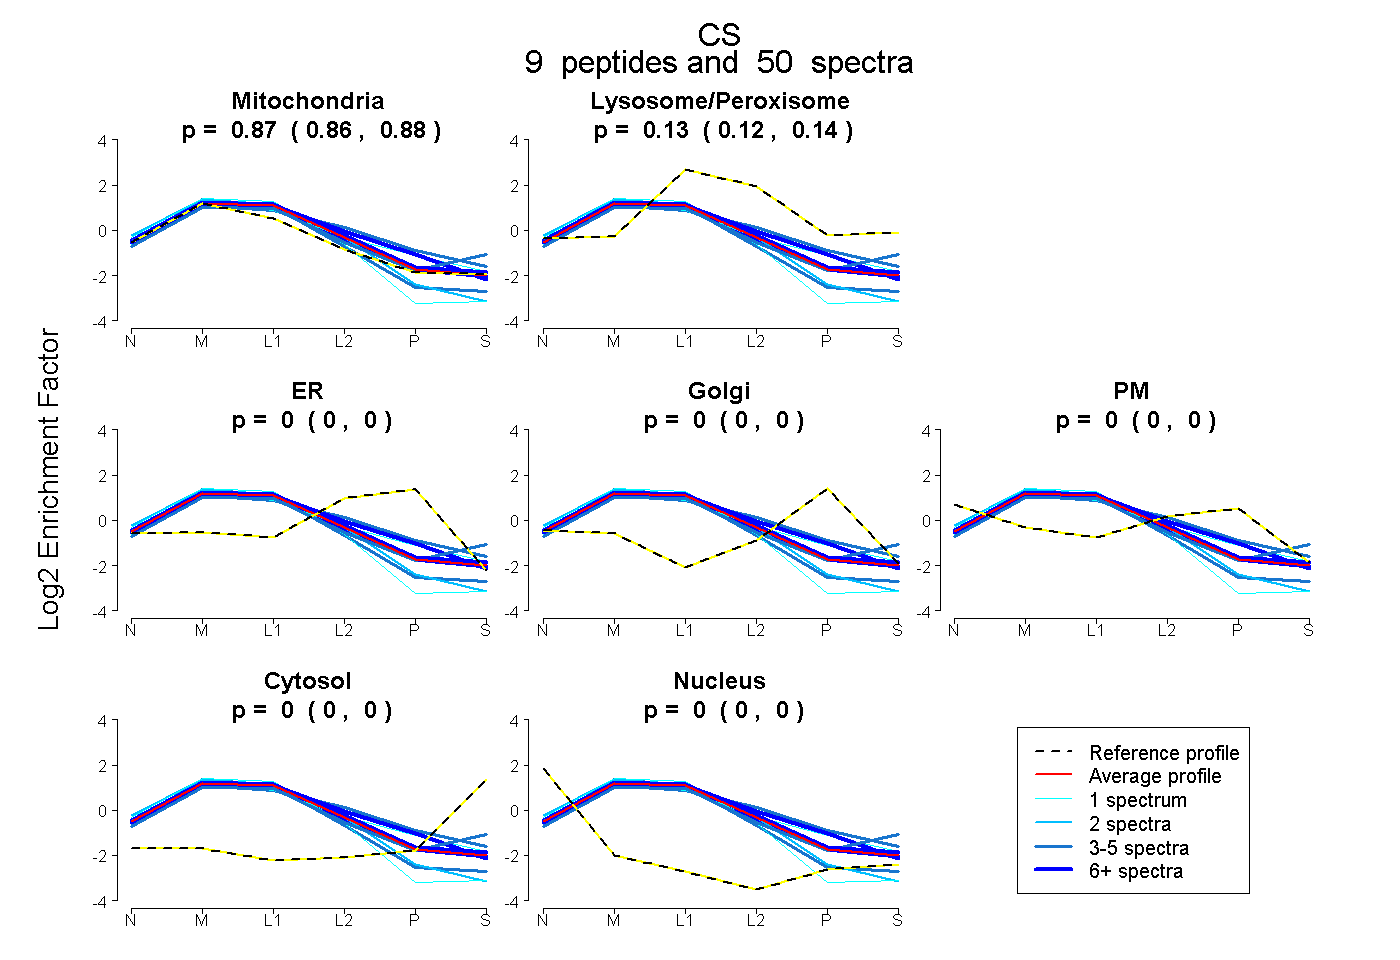 |
0.870 0.863 | 0.876 |
0.130 0.123 | 0.136 |
0.000 0.000 | 0.000 |
0.000 0.000 | 0.000 |
0.000 0.000 | 0.000 |
0.000 0.000 | 0.000 |
0.000 0.000 | 0.000 |
|||
| Plot | Lyso | Other | |||||||||||
| Expt C |
16 peptides |
644 spectra |
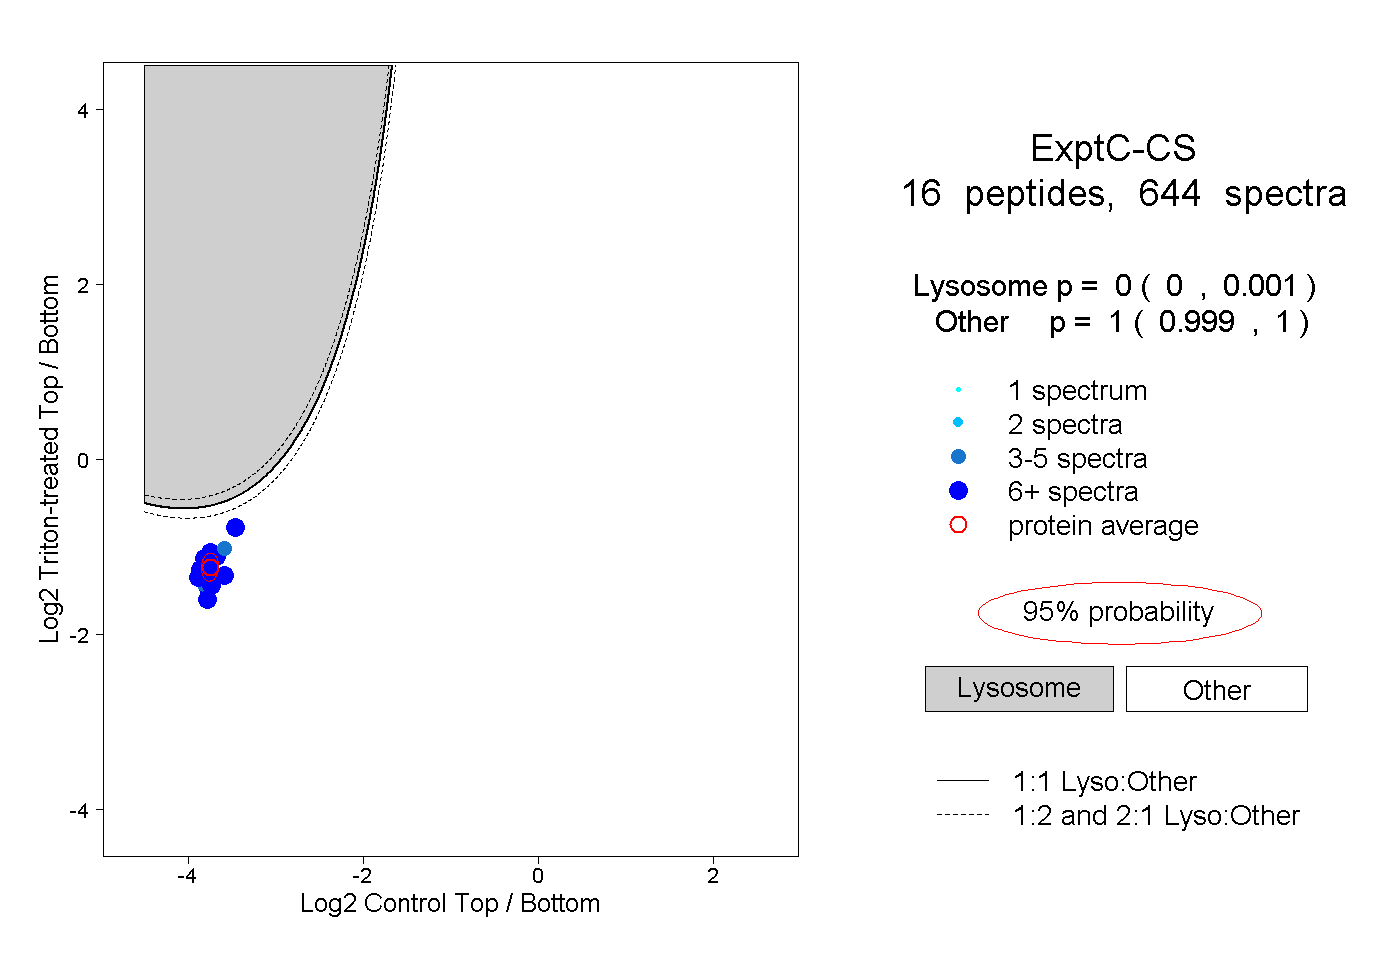 |
0.000 0.000 | 0.001 |
1.000 0.999 | 1.000 |
||||||||
| Plot | Lyso | Other | |||||||||||
| Expt D |
12 peptides |
32 spectra |
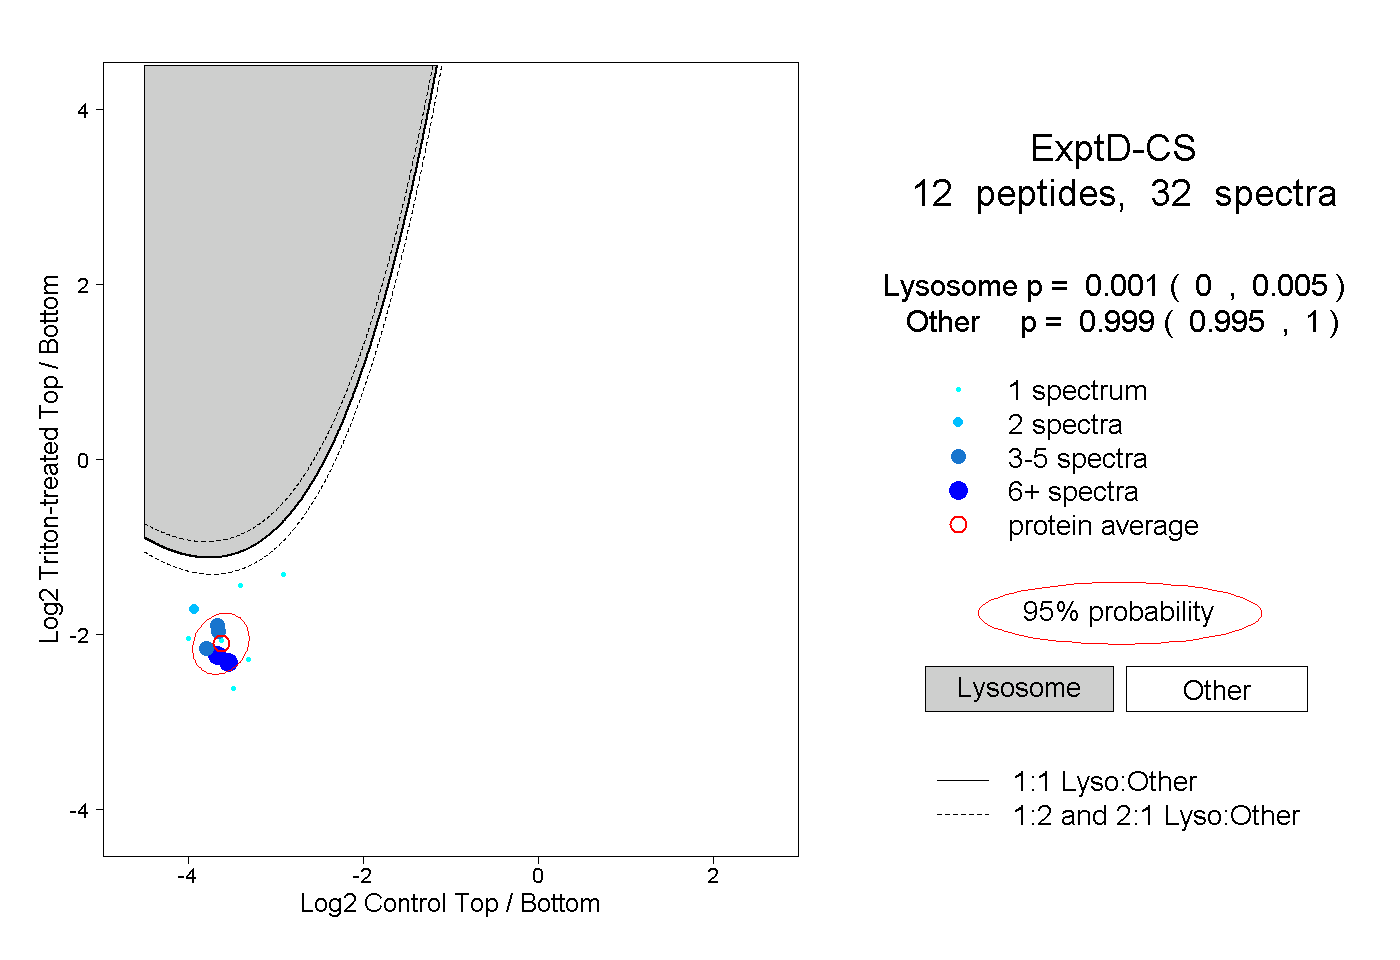 |
0.001 0.000 | 0.005 |
0.999 0.995 | 1.000 |