 1
1peptide
spectra
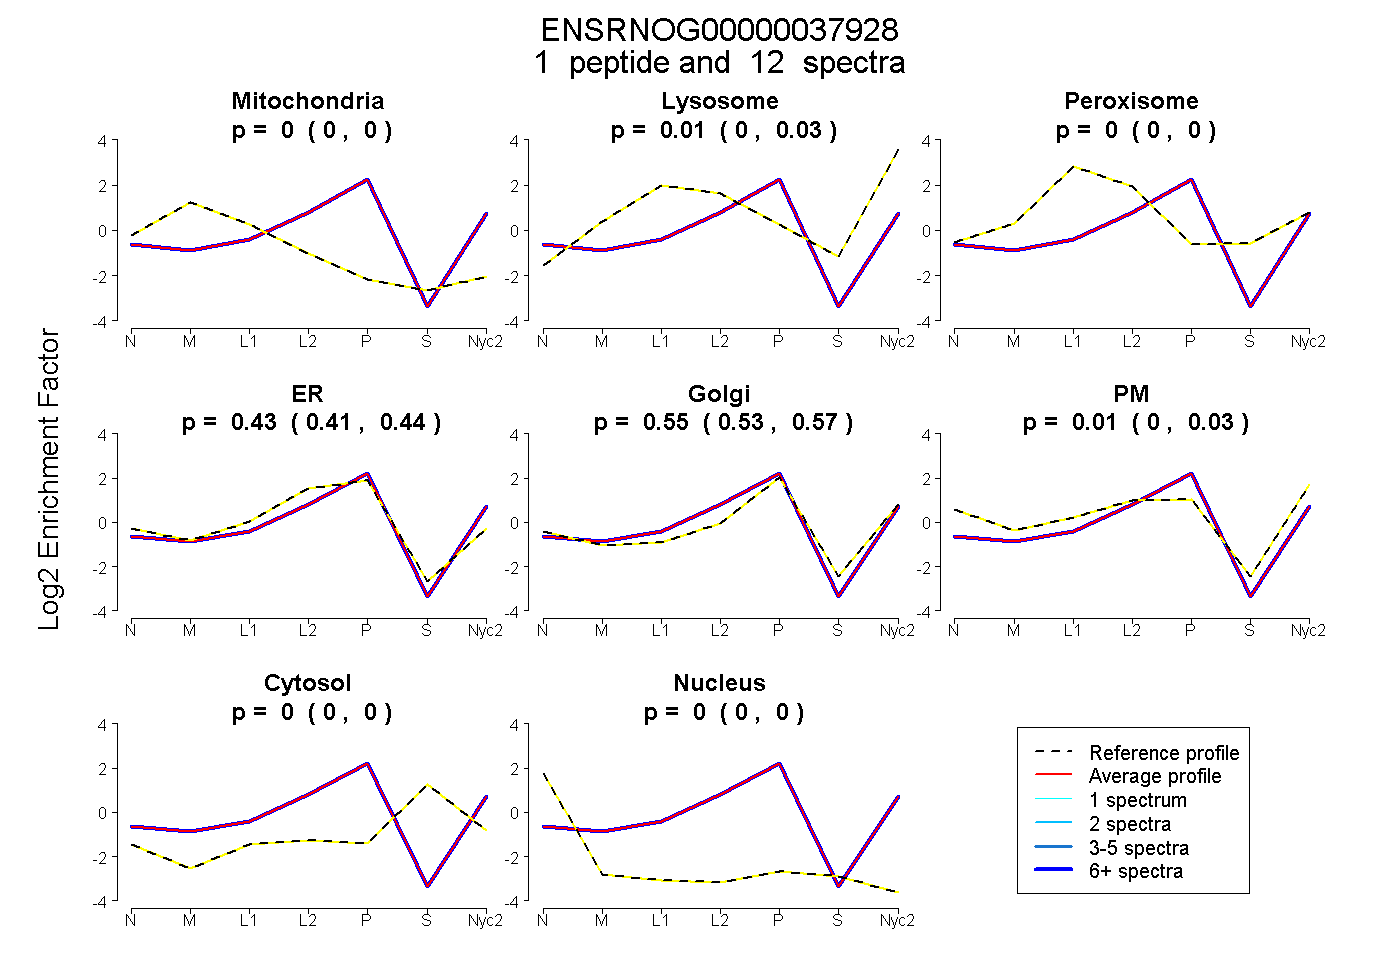
0.000 | 0.000
0.000 | 0.025
0.000 | 0.000
0.408 | 0.443
0.527 | 0.567
0.000 | 0.030
0.000 | 0.000
0.000 | 0.000
1peptide
spectra
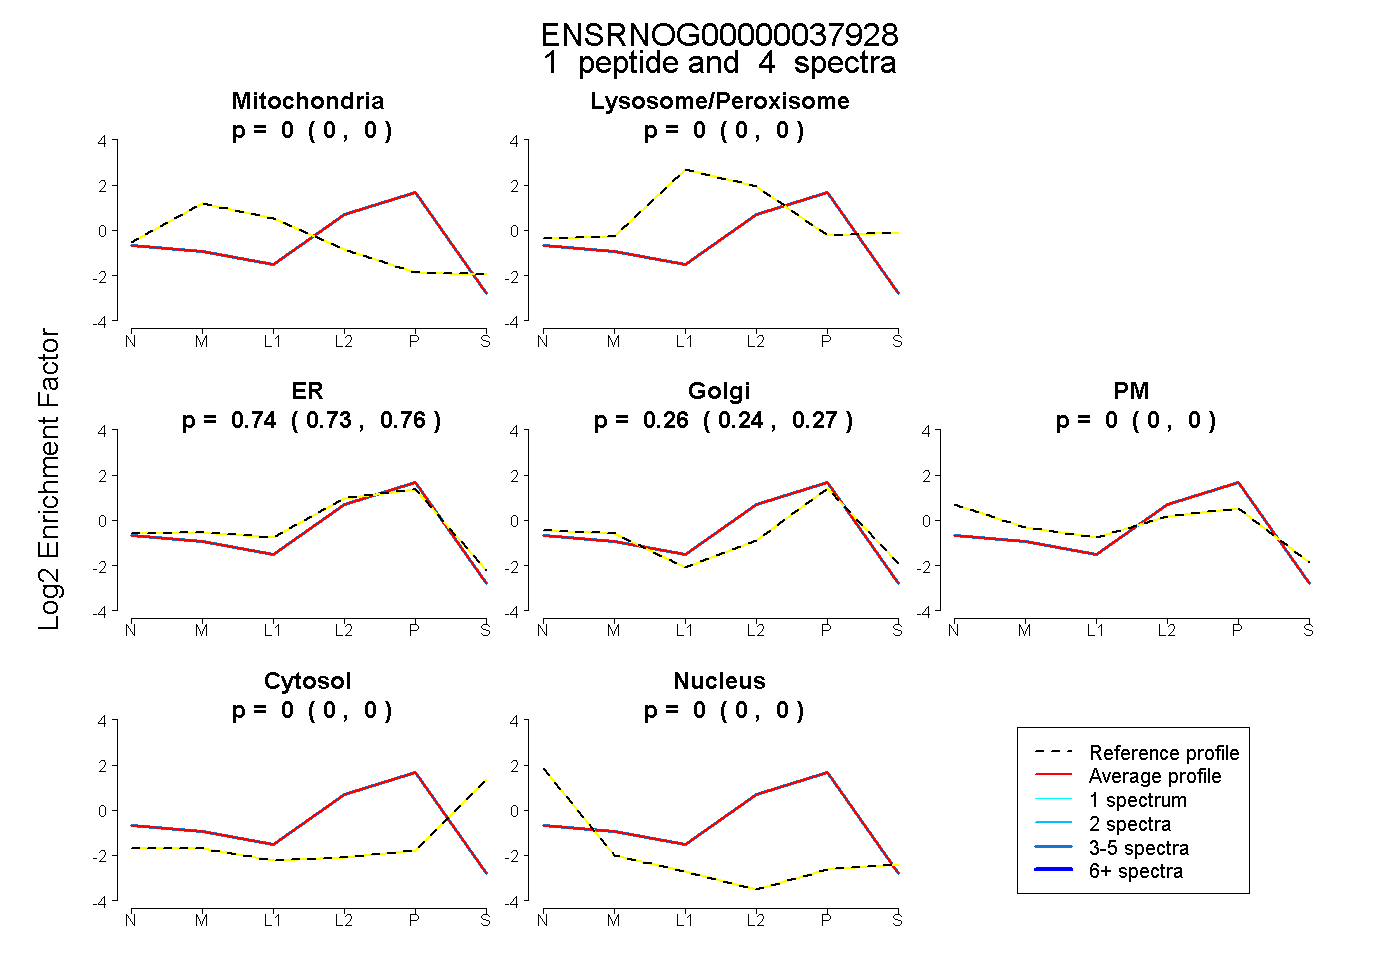
0.000 | 0.000
0.000 | 0.000
0.729 | 0.755
0.243 | 0.268
0.000 | 0.000
0.000 | 0.000
0.000 | 0.000
1peptide
spectra
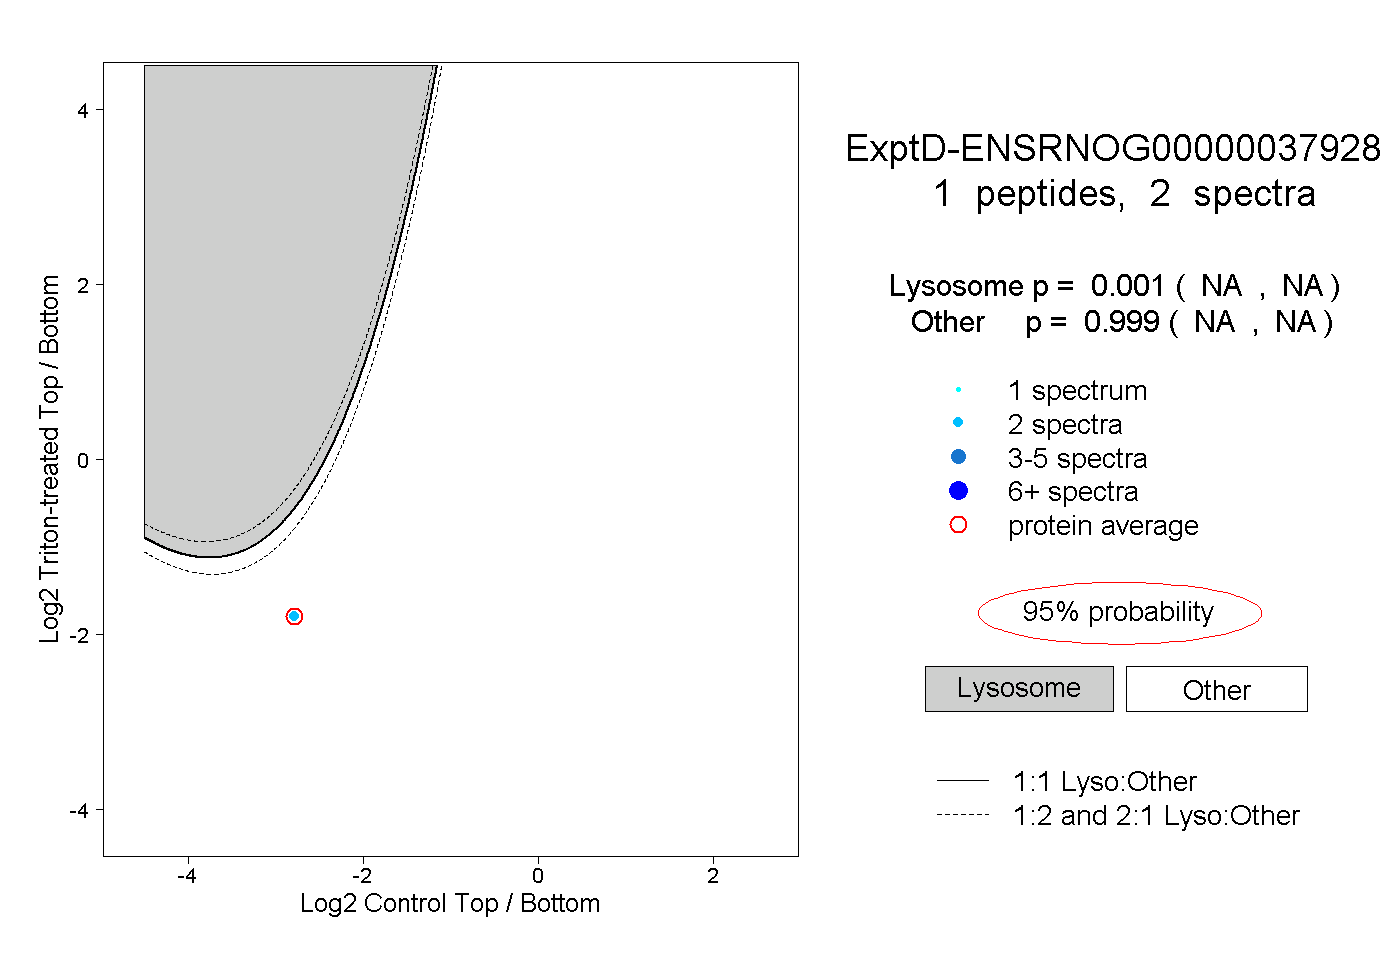
NA | NA
NA | NA