 5
5peptides
spectra
0.000 | 0.024
0.000 | 0.030
0.002 | 0.051
0.000 | 0.000
0.000 | 0.035
0.000 | 0.038
0.909 | 0.951
0.000 | 0.000
| Plot | Mito | Lyso | Perox | ER | Golgi | PM | Cytosol | Nucleus | |||||
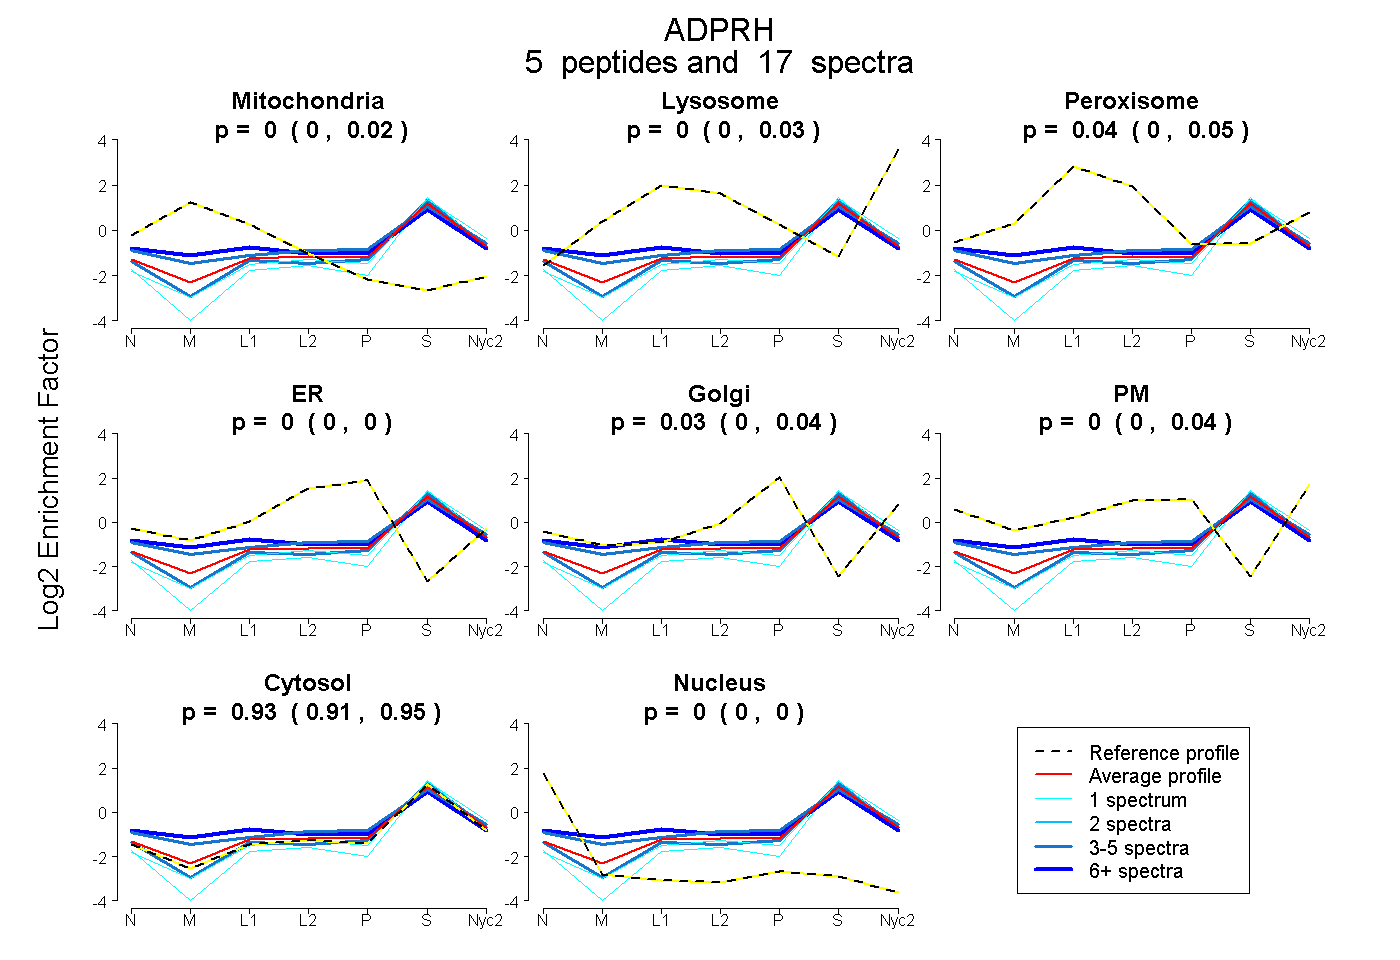
| Expt A |
5 peptides |
17 spectra |
|
0.000 0.000 | 0.024 |
0.001 0.000 | 0.030 |
0.041 0.002 | 0.051 |
0.000 0.000 | 0.000 |
0.026 0.000 | 0.035 |
0.000 0.000 | 0.038 |
0.931 0.909 | 0.951 |
0.000 0.000 | 0.000 |
| 1 spectrum, GLMEVLPEAK | 0.000 | 0.000 | 0.000 | 0.000 | 0.000 | 0.000 | 0.993 | 0.007 | ||
| 1 spectrum, QLAQMGDLEAIDVAQWR | 0.000 | 0.003 | 0.000 | 0.000 | 0.000 | 0.000 | 0.997 | 0.000 | ||
| 4 spectra, AMCIGLR | 0.000 | 0.000 | 0.000 | 0.000 | 0.000 | 0.000 | 1.000 | 0.000 | ||
| 4 spectra, IPFNSHEGGCGAAMR | 0.039 | 0.000 | 0.069 | 0.000 | 0.016 | 0.086 | 0.790 | 0.000 | ||
| 7 spectra, GVNPSNYEK | 0.133 | 0.000 | 0.124 | 0.000 | 0.021 | 0.000 | 0.722 | 0.000 |
| Plot | Lyso | Other | |||||||||||
| Expt C |
3 peptides |
7 spectra |
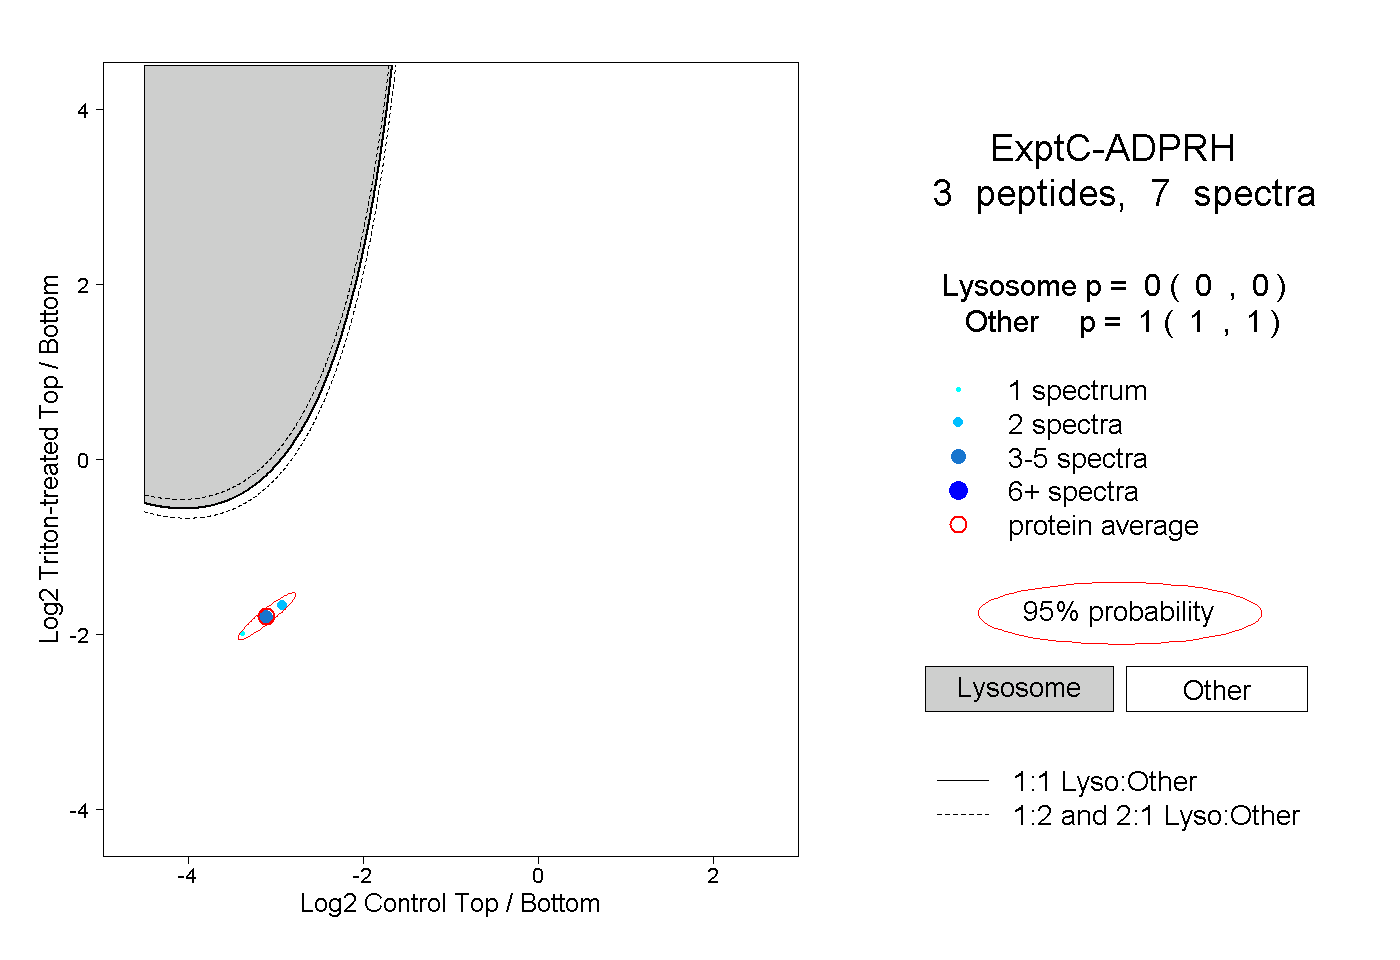 |
0.000 0.000 | 0.000 |
1.000 1.000 | 1.000 |