 2
2peptides
spectra
0.090 | 0.386
0.067 | 0.199
0.000 | 0.000
0.000 | 0.000
0.000 | 0.000
0.000 | 0.000
0.392 | 0.697
0.000 | 0.169
5peptides
spectra
0.000 | 0.000
1.000 | 1.000
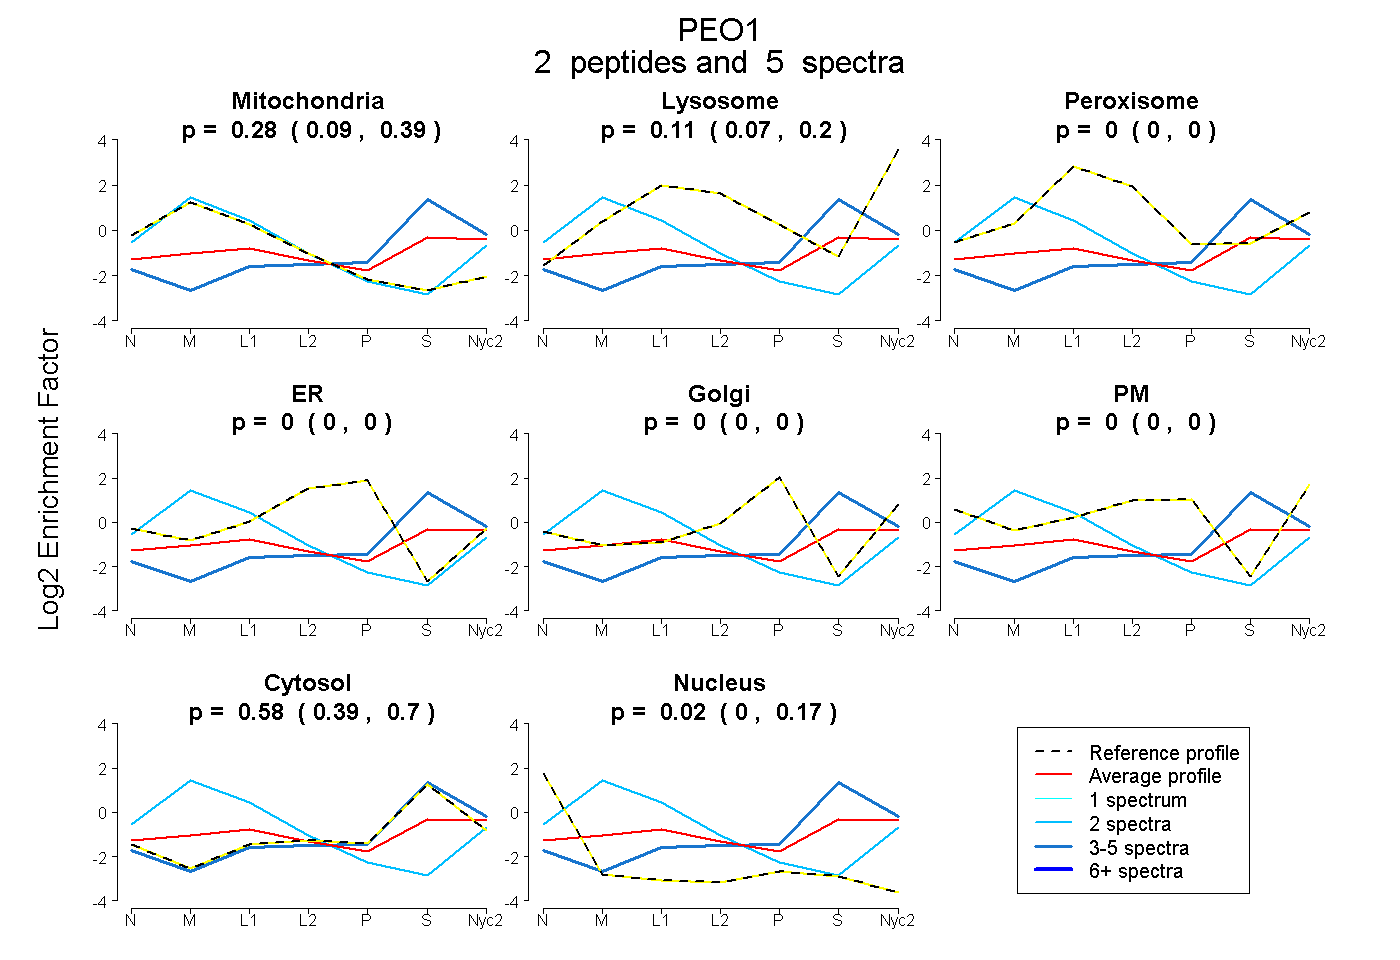
| Plot | Mito | Lyso | Perox | ER | Golgi | PM | Cytosol | Nucleus | |||||
| Expt A |
2 peptides |
5 spectra |
|
0.283 0.090 | 0.386 |
0.111 0.067 | 0.199 |
0.000 0.000 | 0.000 |
0.000 0.000 | 0.000 |
0.000 0.000 | 0.000 |
0.000 0.000 | 0.000 |
0.581 0.392 | 0.697 |
0.025 0.000 | 0.169 |
||
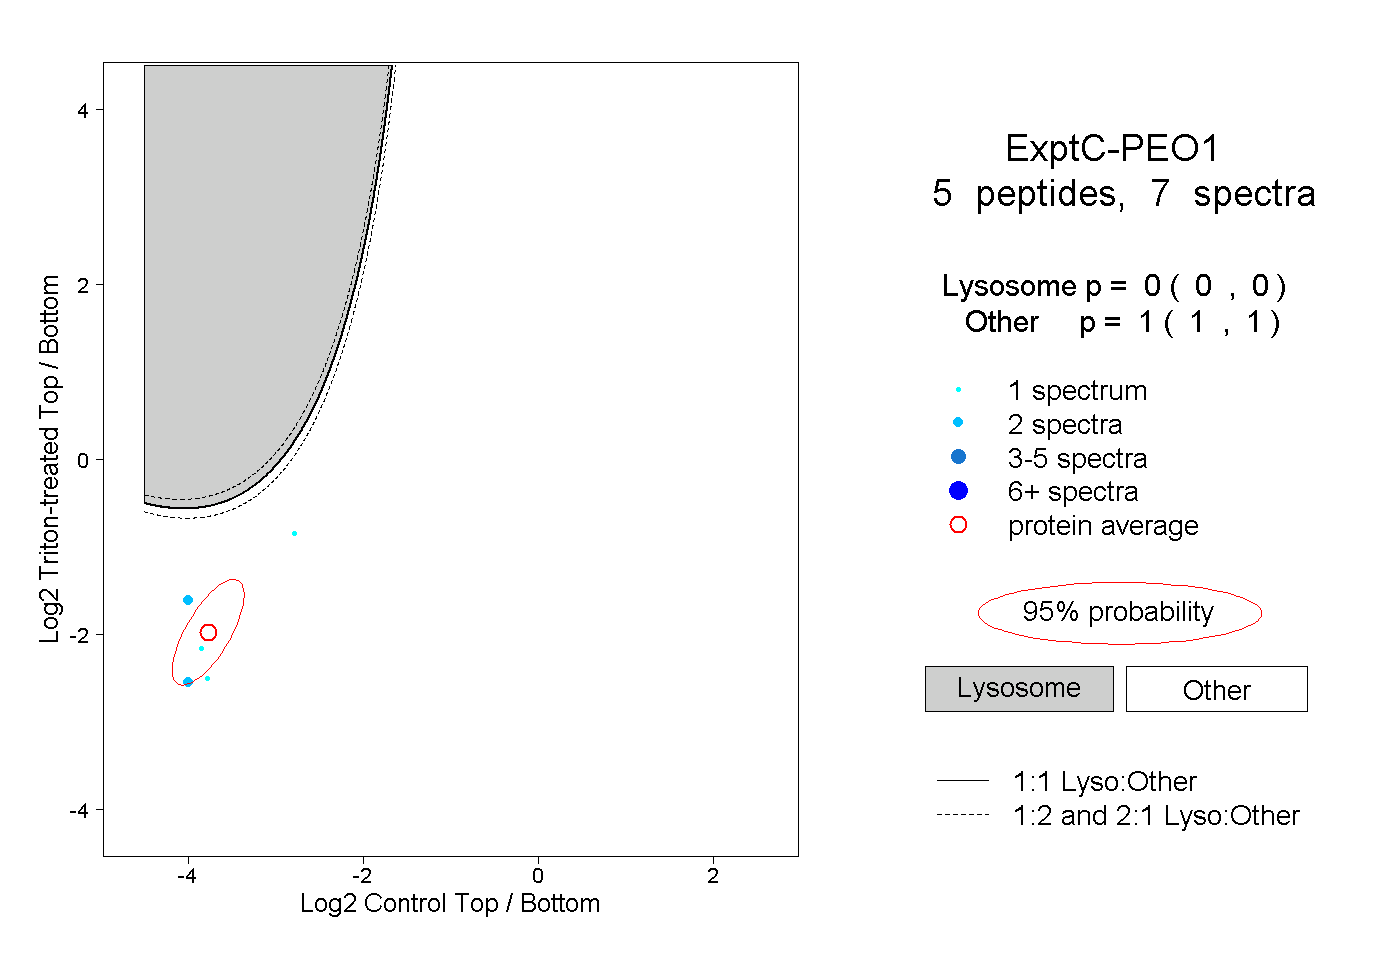
| Plot | Lyso | Other | |||||||||||
| Expt C |
5 peptides |
7 spectra |
|
0.000 0.000 | 0.000 |
1.000 1.000 | 1.000 |