 1
1peptide
spectra
0.107 | 0.284
0.000 | 0.000
0.325 | 0.498
0.000 | 0.076
0.000 | 0.217
0.000 | 0.127
0.137 | 0.271
0.000 | 0.032
1peptide
spectra
0.000 | 0.000
1.000 | 1.000
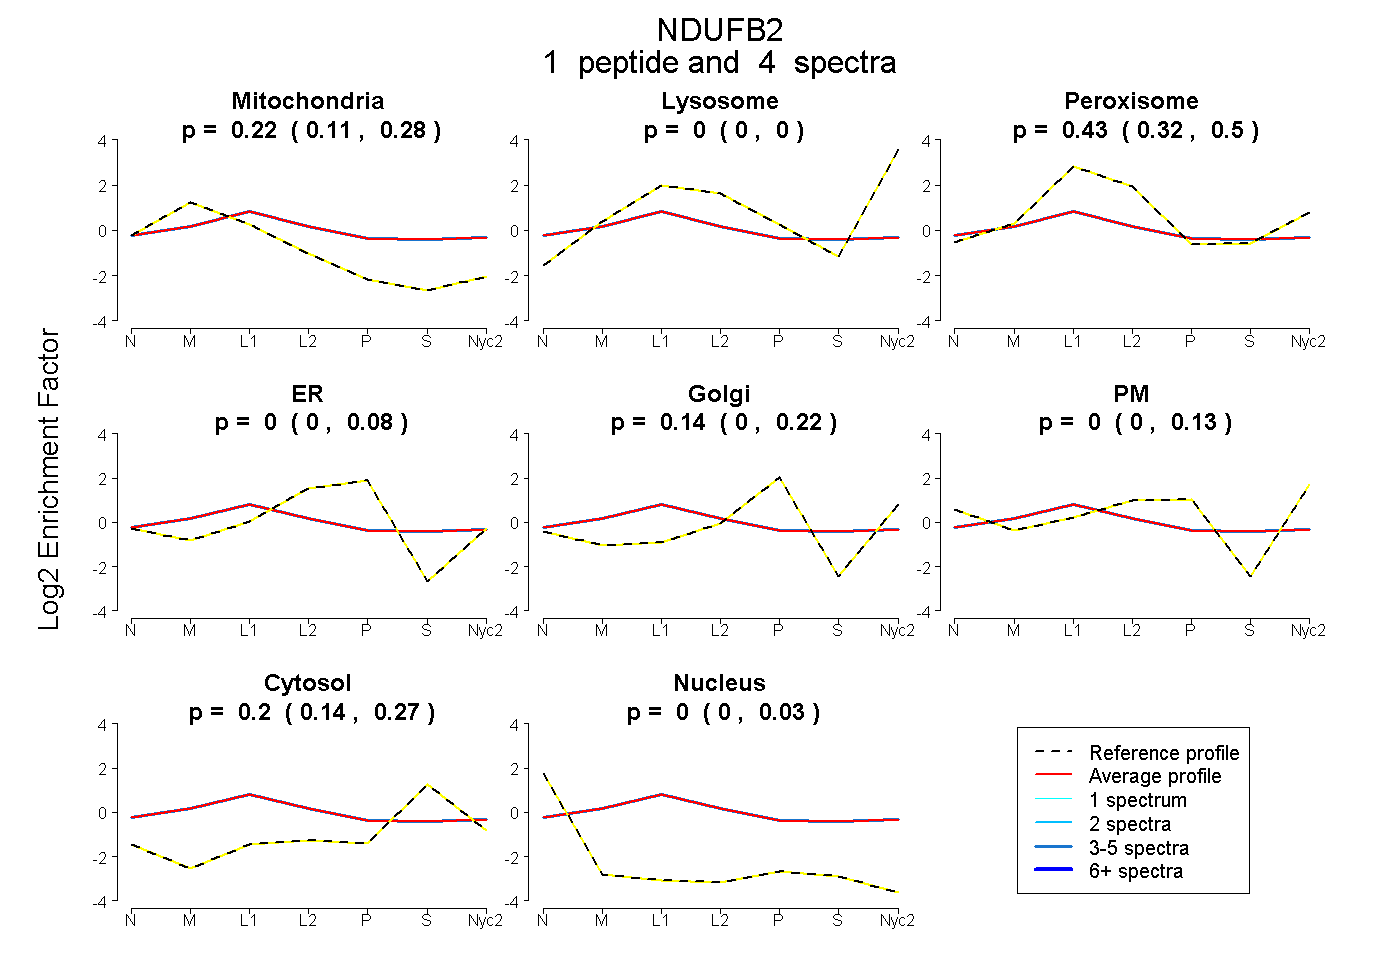
| Plot | Mito | Lyso | Perox | ER | Golgi | PM | Cytosol | Nucleus | |||||
| Expt A |
1 peptide |
4 spectra |
|
0.218 0.107 | 0.284 |
0.000 0.000 | 0.000 |
0.432 0.325 | 0.498 |
0.000 0.000 | 0.076 |
0.145 0.000 | 0.217 |
0.000 0.000 | 0.127 |
0.205 0.137 | 0.271 |
0.000 0.000 | 0.032 |
||
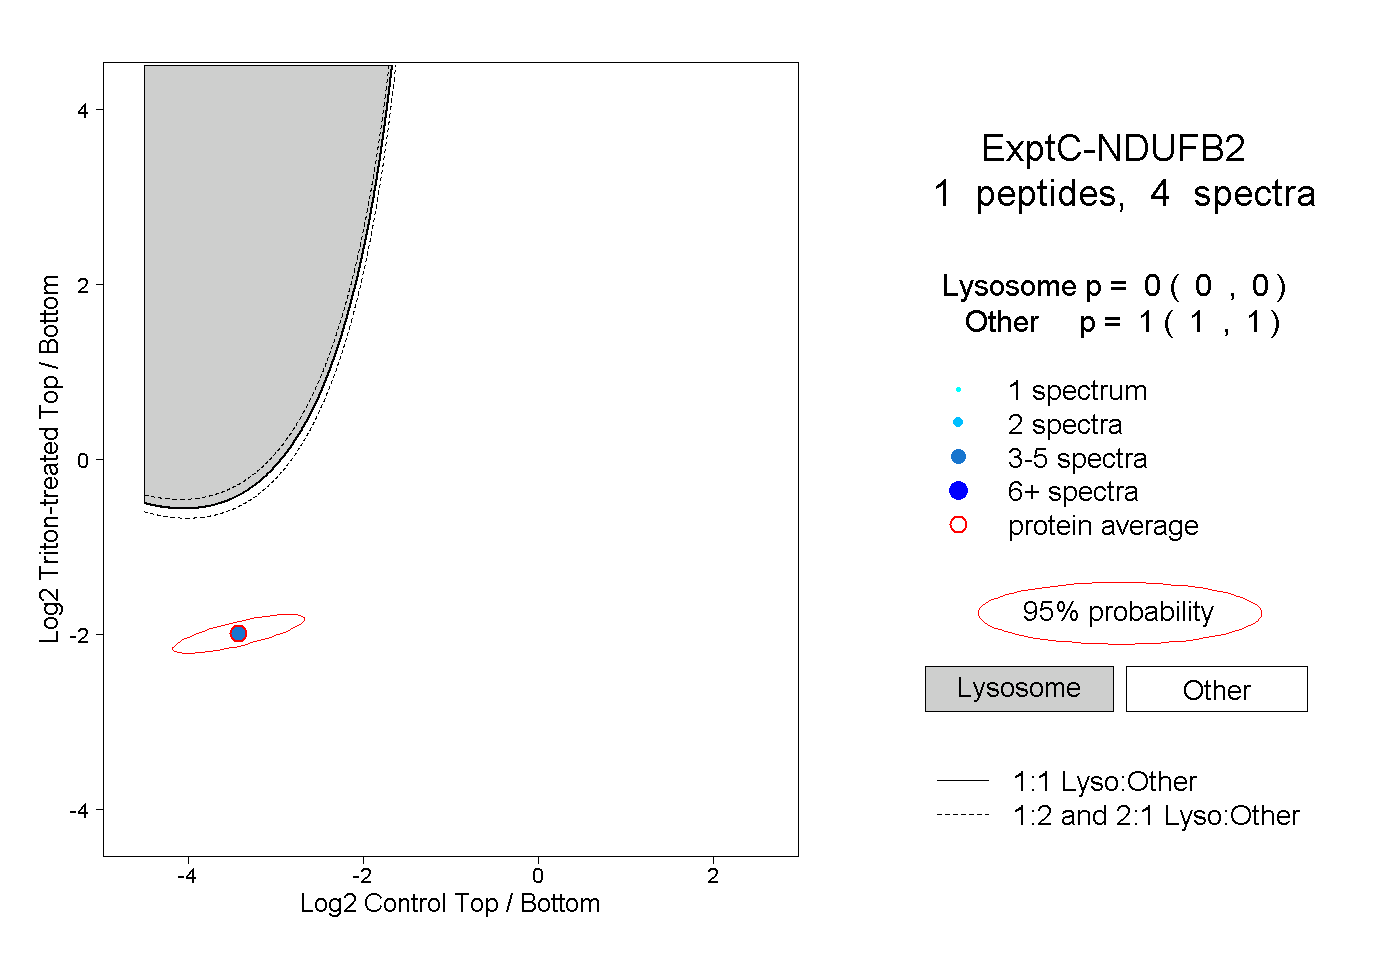
| Plot | Lyso | Other | |||||||||||
| Expt C |
1 peptide |
4 spectra |
|
0.000 0.000 | 0.000 |
1.000 1.000 | 1.000 |