 2
2peptides
spectra
0.000 | 0.071
0.096 | 0.294
0.000 | 0.130
0.000 | 0.157
0.000 | 0.092
0.597 | 0.766
0.000 | 0.003
1peptide
spectrum
NA | NA
NA | NA
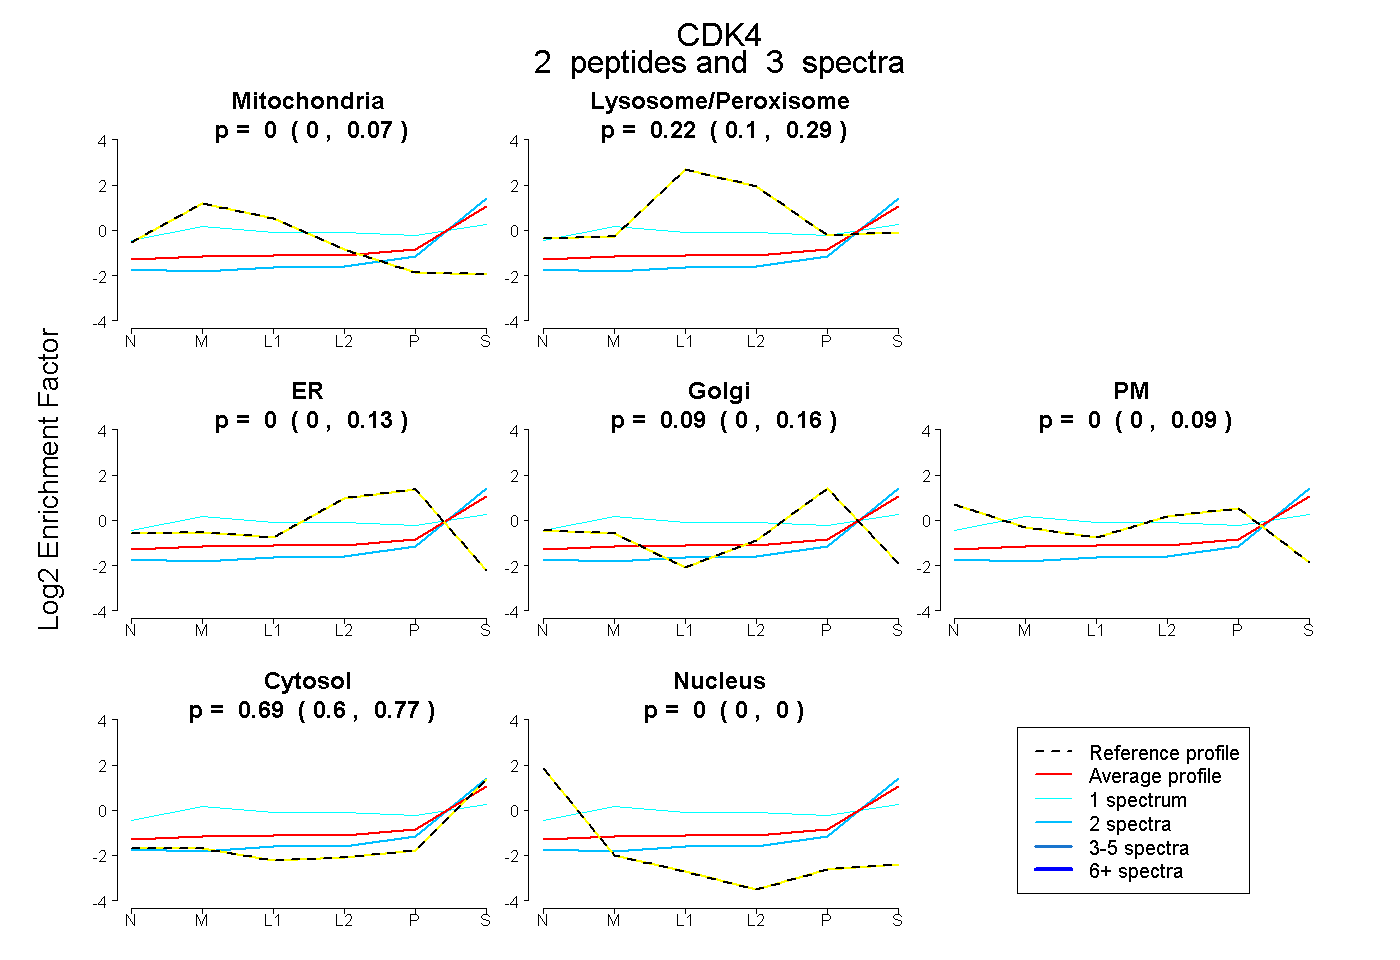
| Plot | Mito | Lyso or Perox | ER | Golgi | PM | Cytosol | Nucleus | ||||||
| Expt B |
2 peptides |
3 spectra |
|
0.000 0.000 | 0.071 |
0.223 0.096 | 0.294 |
0.000 0.000 | 0.130 |
0.091 0.000 | 0.157 |
0.000 0.000 | 0.092 |
0.686 0.597 | 0.766 |
0.000 0.000 | 0.003 |
|||
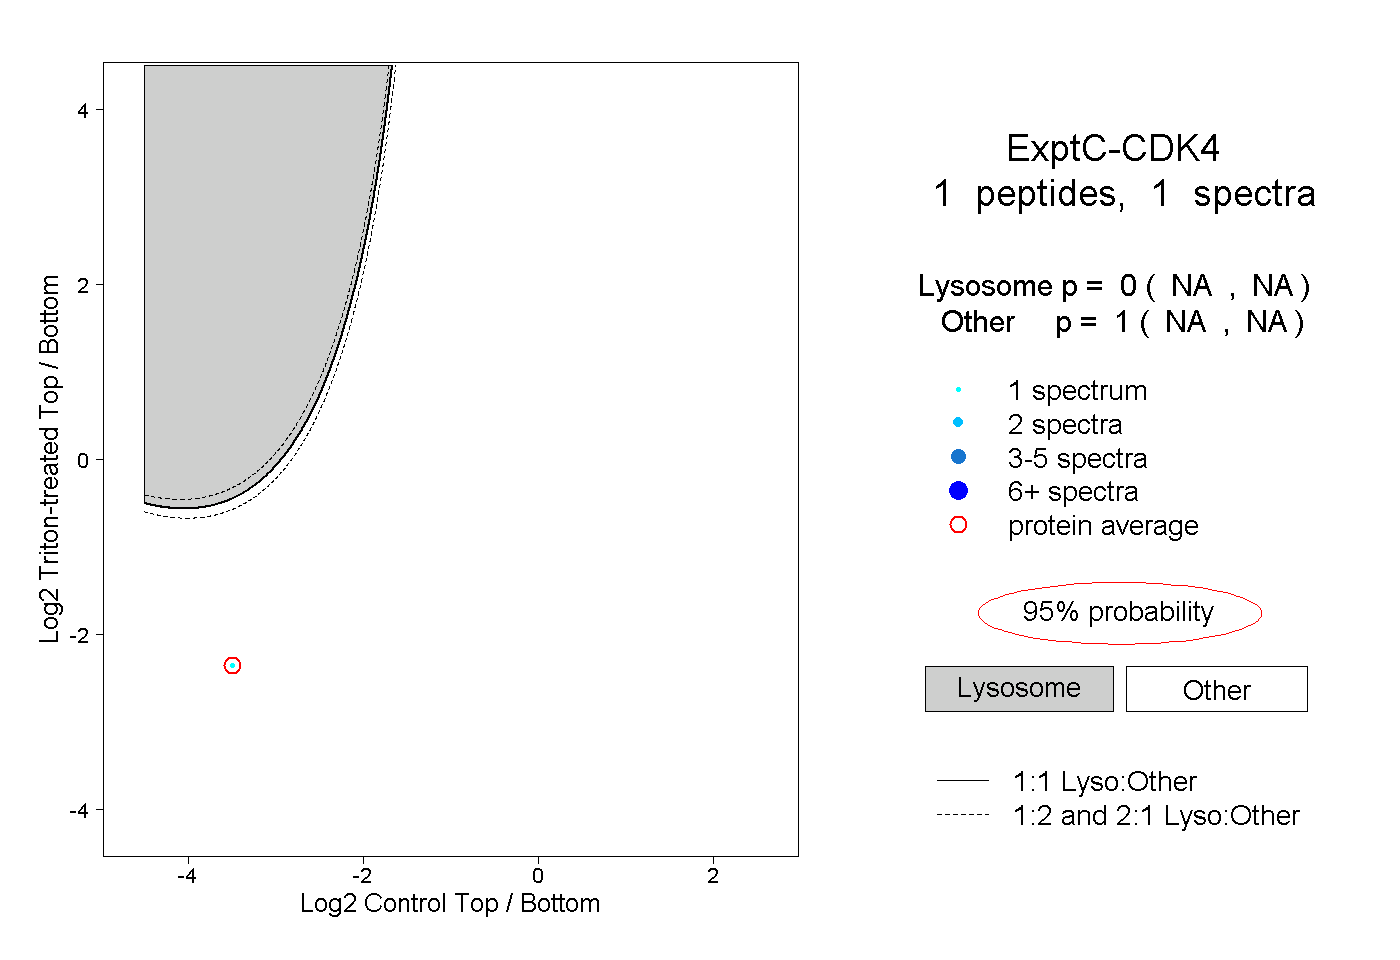
| Plot | Lyso | Other | |||||||||||
| Expt C |
1 peptide |
1 spectrum |
|
0.000 NA | NA |
1.000 NA | NA |