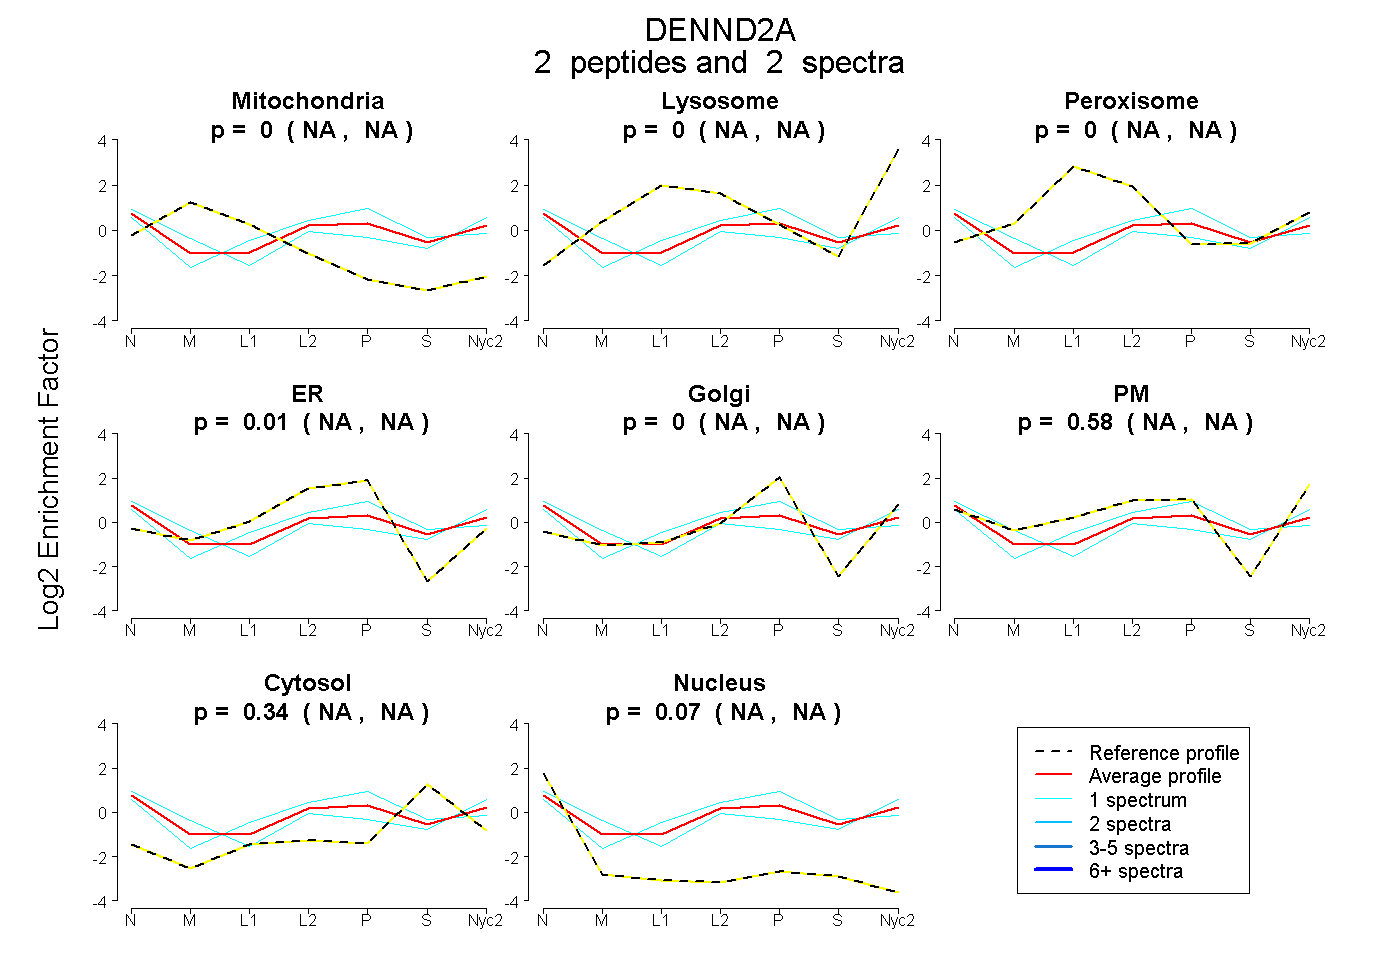
 2
2peptides
spectra
NA | NA
NA | NA
NA | NA
NA | NA
NA | NA
NA | NA
NA | NA
NA | NA
| Plot | Mito | Lyso | Perox | ER | Golgi | PM | Cytosol | Nucleus | |||||
| Expt A |
2 peptides |
2 spectra |
|
0.000 NA | NA |
0.000 NA | NA |
0.000 NA | NA |
0.011 NA | NA |
0.000 NA | NA |
0.575 NA | NA |
0.343 NA | NA |
0.071 NA | NA |
| 1 spectrum, GISPALVQPLMR | 0.005 | 0.000 | 0.000 | 0.000 | 0.000 | 0.587 | 0.278 | 0.129 | ||
| 1 spectrum, ENPYEDVESHGR | 0.000 | 0.000 | 0.000 | 0.336 | 0.000 | 0.275 | 0.389 | 0.000 |
| Plot | Lyso | Other | |||||||||||
| Expt C |
2 peptides |
2 spectra |
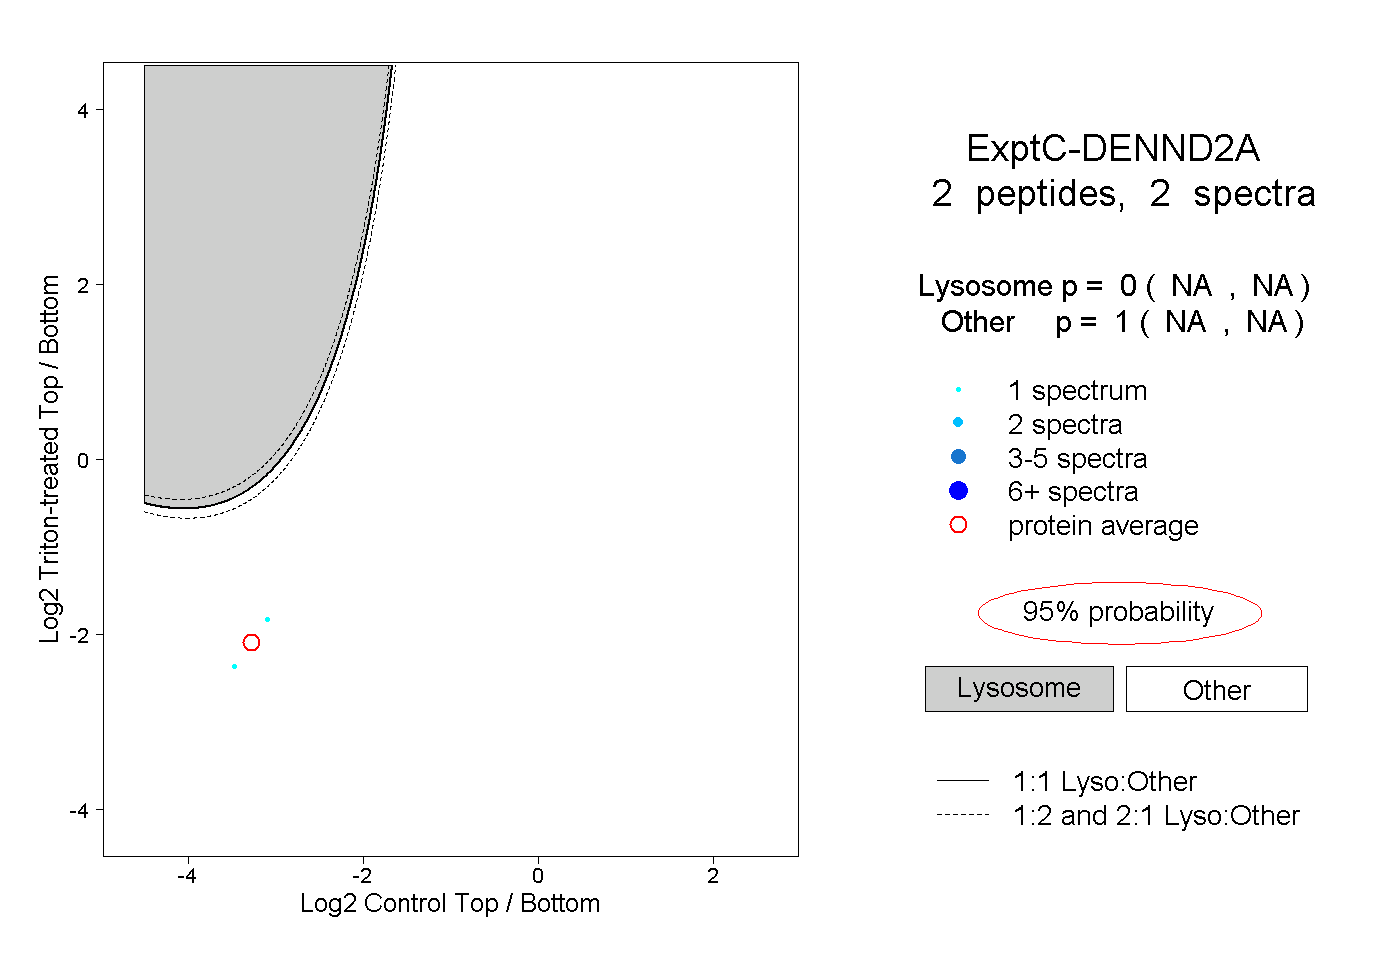 |
0.000 NA | NA |
1.000 NA | NA |