 3
3peptides
spectra
0.000 | 0.000
0.000 | 0.000
0.000 | 0.000
0.997 | 1.000
0.000 | 0.000
0.000 | 0.000
0.000 | 0.000
0.000 | 0.002
| Plot | Mito | Lyso | Perox | ER | Golgi | PM | Cytosol | Nucleus | |||||
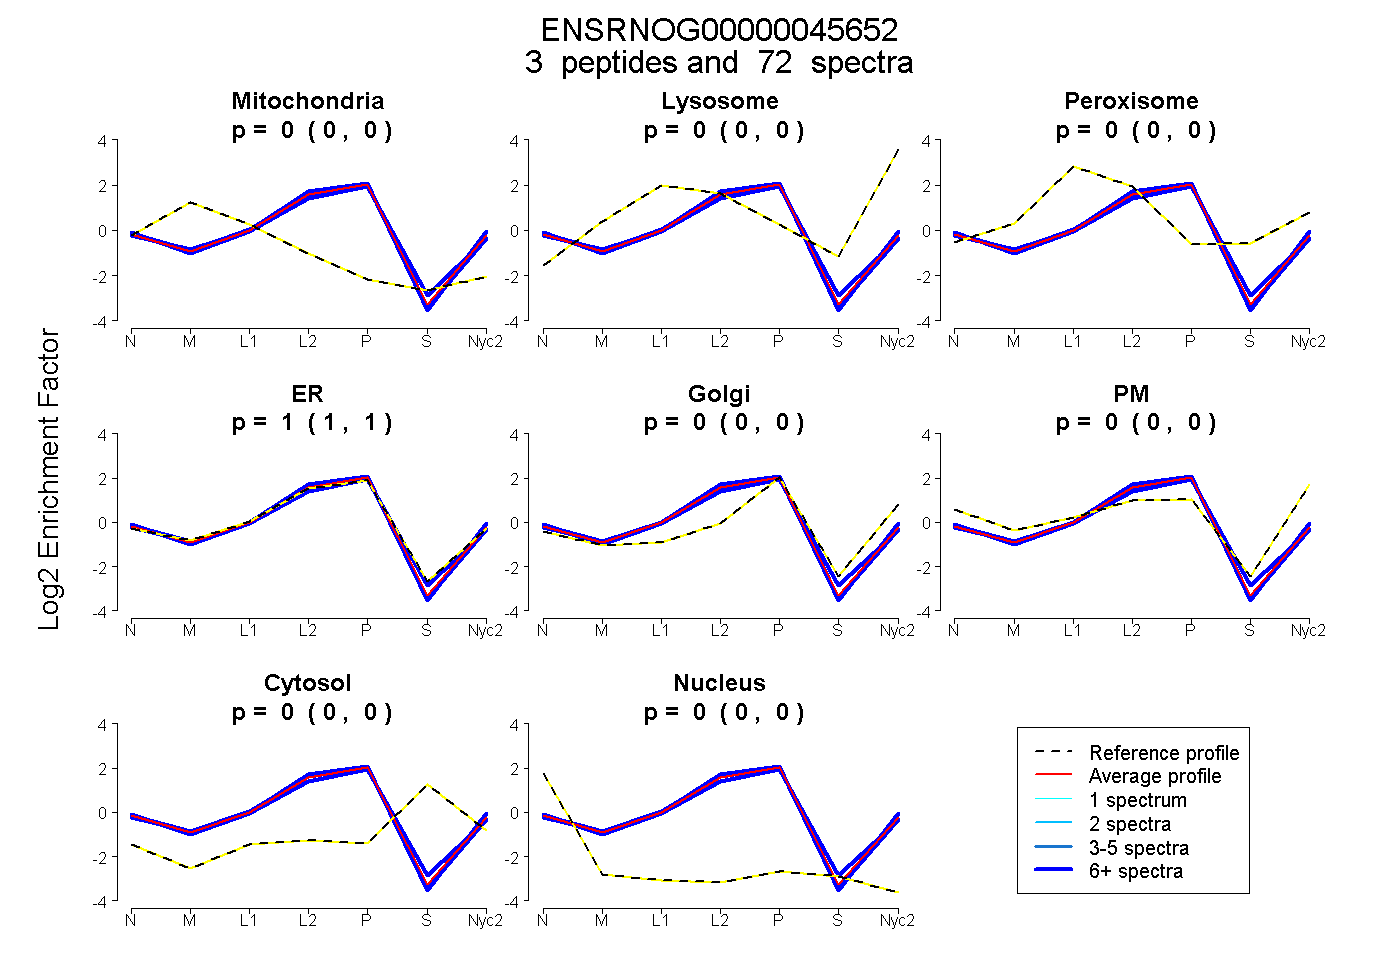
| Expt A |
3 peptides |
72 spectra |
|
0.000 0.000 | 0.000 |
0.000 0.000 | 0.000 |
0.000 0.000 | 0.000 |
0.999 0.997 | 1.000 |
0.000 0.000 | 0.000 |
0.000 0.000 | 0.000 |
0.000 0.000 | 0.000 |
0.001 0.000 | 0.002 |
| 23 spectra, FSPGYK | 0.000 | 0.000 | 0.000 | 0.993 | 0.000 | 0.007 | 0.000 | 0.000 | ||
| 21 spectra, DTVSNK | 0.000 | 0.000 | 0.000 | 0.967 | 0.008 | 0.000 | 0.000 | 0.026 | ||
| 28 spectra, LVDVWTYELQR | 0.000 | 0.000 | 0.000 | 0.997 | 0.000 | 0.000 | 0.000 | 0.003 |
| Plot | Mito | Lyso or Perox | ER | Golgi | PM | Cytosol | Nucleus | ||||||
| Expt B |
3 peptides |
21 spectra |
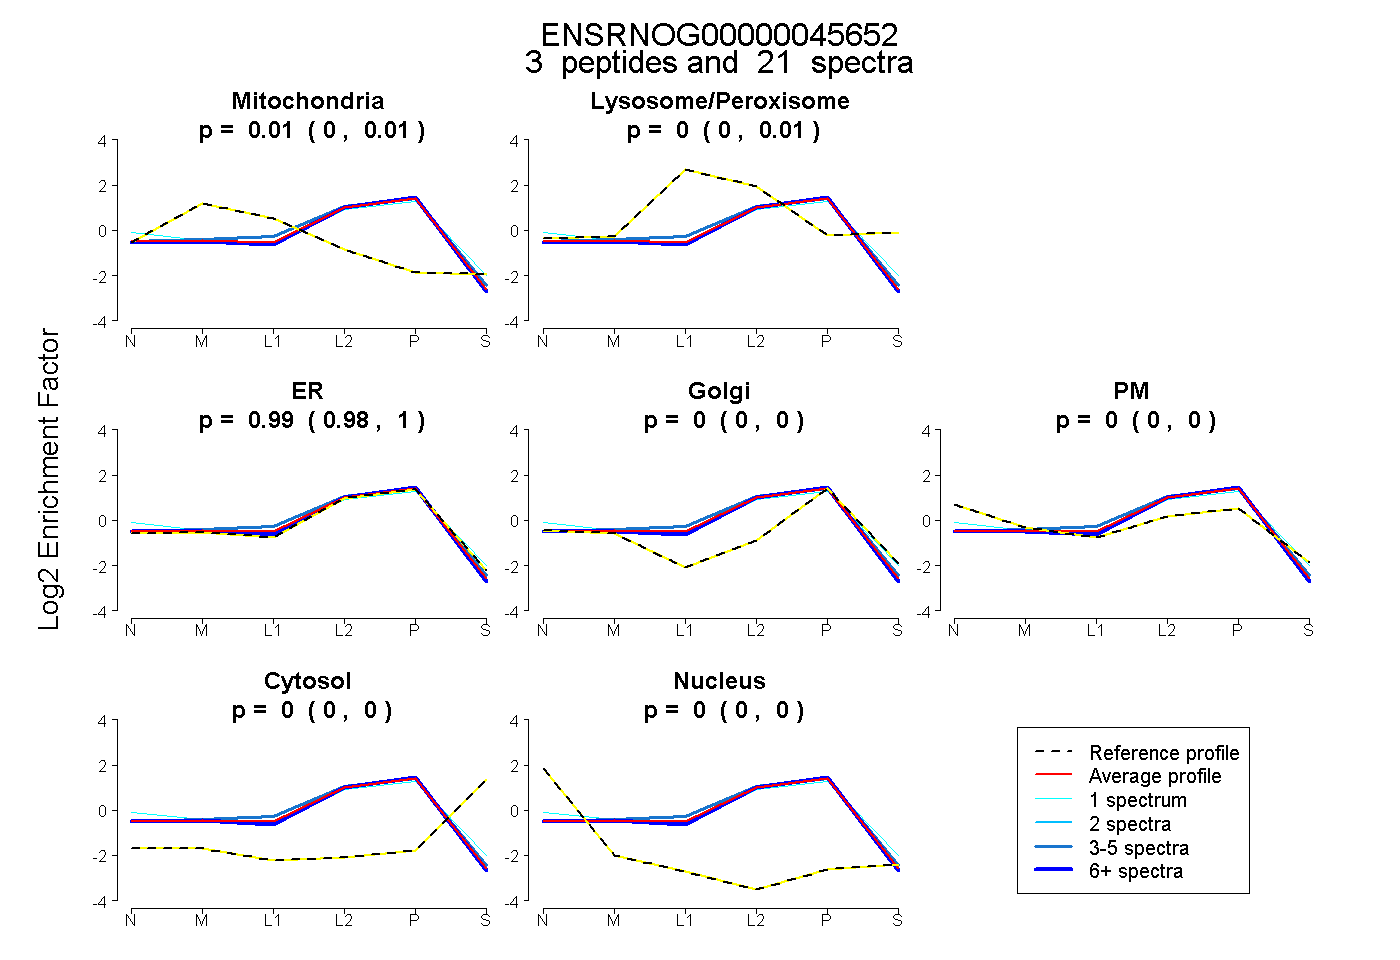 |
0.007 0.000 | 0.010 |
0.000 0.000 | 0.014 |
0.993 0.980 | 0.999 |
0.000 0.000 | 0.000 |
0.000 0.000 | 0.000 |
0.000 0.000 | 0.000 |
0.000 0.000 | 0.000 |
|||
| Plot | Lyso | Other | |||||||||||
| Expt C |
3 peptides |
219 spectra |
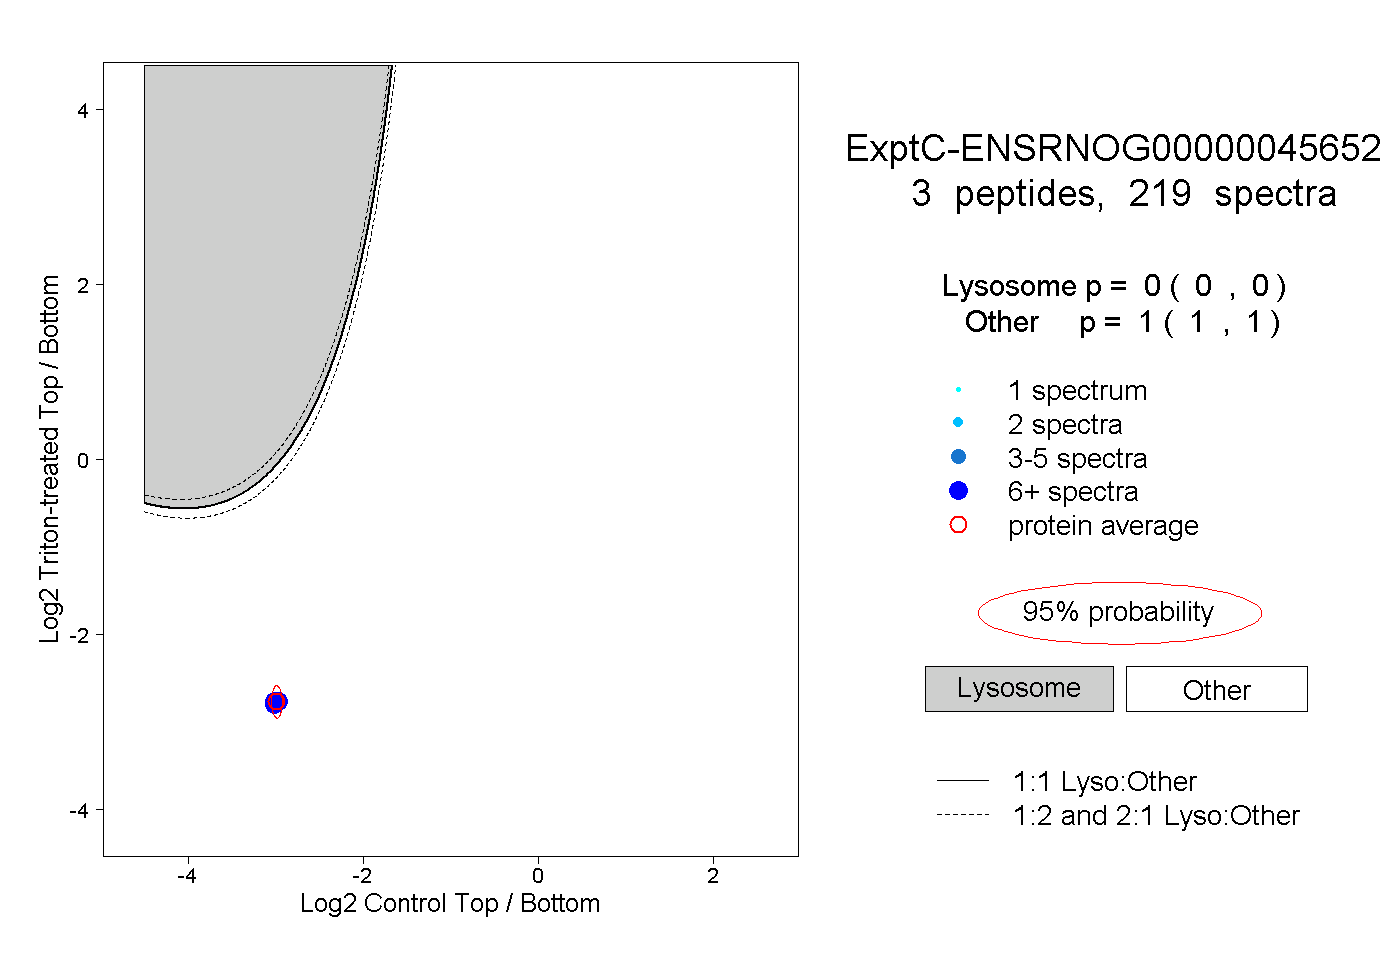 |
0.000 0.000 | 0.000 |
1.000 1.000 | 1.000 |
||||||||
| Plot | Lyso | Other | |||||||||||
| Expt D |
2 peptides |
10 spectra |
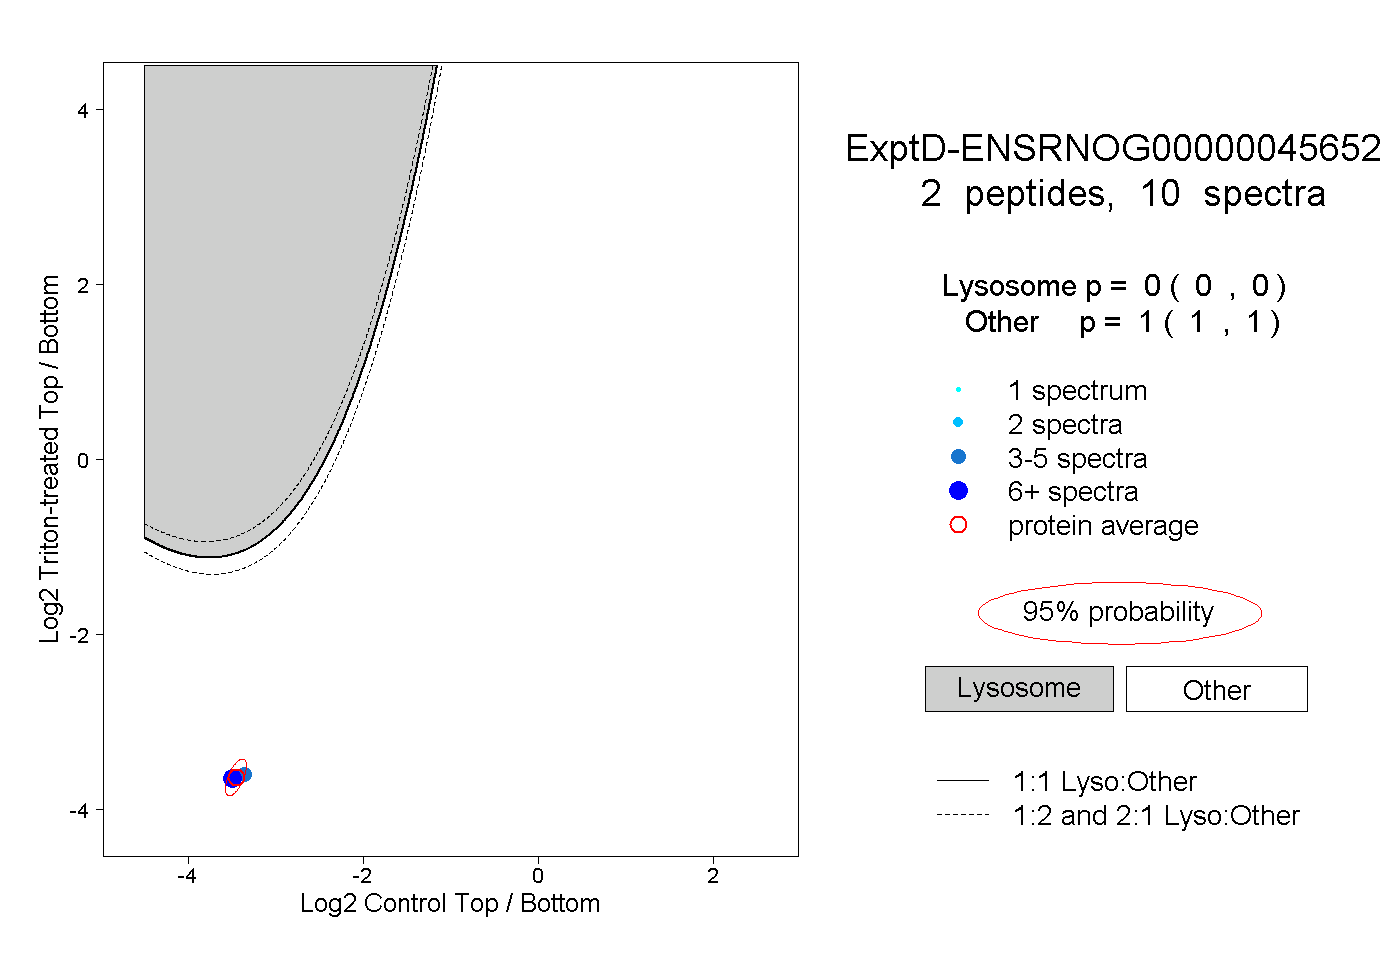 |
0.000 0.000 | 0.000 |
1.000 1.000 | 1.000 |